

2 Hydrographs and flood terminology explained
A river hydrograph is simply a depiction of the flow in a river on a graph. When it shows the response in flow to a heavy rain event (storm), then it is referred to as a storm hydrograph. Figure 4 shows the key features of such a graph. The vertical axis on the left shows the flow (or discharge) of the river measured in cubic metres per second (sometimes abbreviated to cumecs), while the horizontal axis at the bottom denotes time (usually in days). The area under the curve (shaded in Figure 4) represents the total volume of water discharged during the flow event.
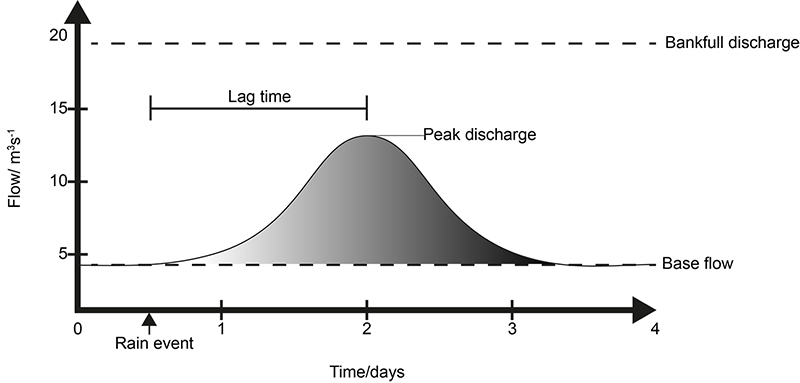
The key items that the hydrograph depicts are:
- Baseflow: the steady level of the river with normal rainfall and no storm event.
- Lag time: the time that elapses between the storm event and the flood peak arriving at a particular location.
- Bank-full flow: the maximum flow rate that the channel can contain. If the flow rate exceeds this value, water will spill out of the channel onto the floodplain.
- Peak discharge: the maximum flow rate following a storm event.
- Time above threshold: the duration of water coming out of the river channel to inundate the floodplain.
In a densely populated country like the UK, most of its rivers are quite heavily managed and that management can be altered to change the shape of a storm hydrograph. For example:
- Clearing drains and ditches high in the catchment will help water move quickly to the river, reducing the lag time.
- Raising flood embankments will increase the bank-full flow.
- Water abstraction for irrigation will lower the base flow.
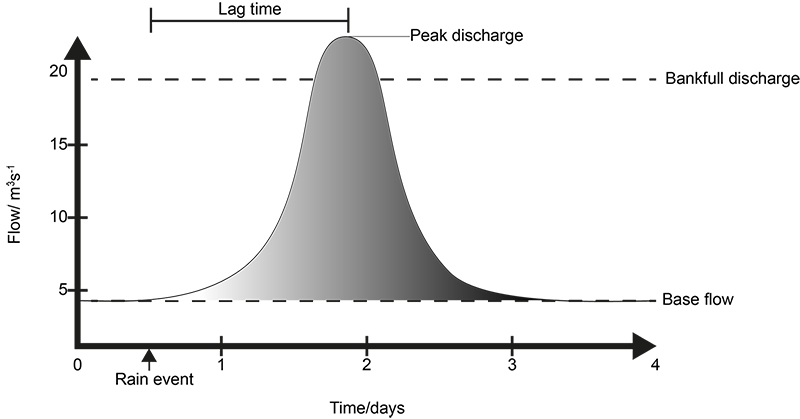
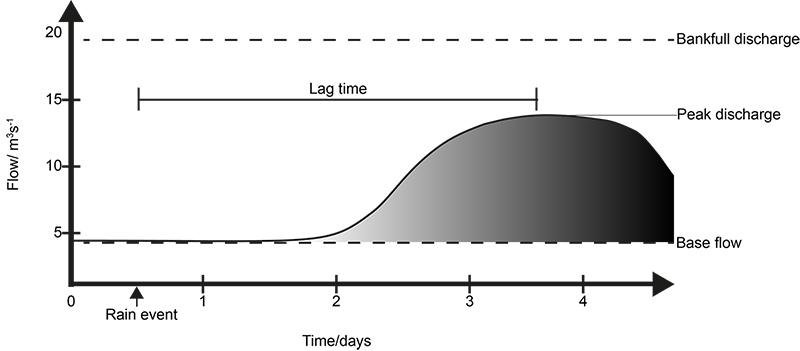
In terms of managing flood risk, the most important aspect of a storm hydrograph is the peak flow, as this determines the maximum height of the floodwater and therefore the area that would be affected. While the initial response to floods is to build higher flood defences (e.g. embankments to keep the water in the channel), this can only work to a limited degree. By keeping all the water in the channel through one vulnerable area, the risk to the next vulnerable area downstream increases. There is now a move away from such engineered solutions to more natural flood management by giving water the room to spread across floodplains. The effects of such Natural Flood Management (NFM) are shown in Figure 5.
Activity 2
Using the graphs in Figure 5, describe how you think reconnecting the floodplain to the river has reduced flood risk in the urban area.
Discussion
Reconnecting the channel to its floodplain allows flood flows to spread out across the rural floodplain higher in the catchment, which then delays the arrival of the flood in the town and also reduces its peak level because much of the water has been delayed by moving slowly across floodplain rather than quickly in the channel.