

2 The neoclassical model of perfect competition
To understand the neoclassical argument in favour of competition and against market power, we need to explore the perfectly competitive model of the economy in more detail. The main feature of this model is the assumption that no single consumer or firm has power to influence the price at which a good or service is bought and sold.
Neoclassical economic models in general concentrate on the analysis of equilibrium. Let’s focus on a market for a single good for now. When the market is in equilibrium, no individual has any incentive to change what they are doing unless factors outside the model change. These factors, not being explained by the model, are called exogenous factors or variables. Much of neoclassical theory is concerned with understanding the conditions under which an equilibrium exists and how it depends on exogenous factors. Technology is often treated as an exogenous factor for instance.
Activity 2: Market equilibrium and change
Task 1
Watch the following video, which shows how market equilibrium is reached. Note that so far we have only looked at the shape of a single consumer’s demand curve, and of a single firm’s supply curve. The market demand and the market supply curves represent the total demand and the total supply of all consumers and firms in the economy. This video also shows how demand and supply change
- when an exogenous variable affects demand – in this case, consumers’ income
- when an exogenous variable affects supply – in this case, bird flu drastically reducing the poultry population.

Transcript: Video 1: Market equilibrium
Task 2
Now answer the following questions to check your understanding
a) Click on the point of equilibrium in the diagram below.
b) The market is initially in equilibrium given by the intersection of the supply curve S1 and demand curve D1 in Figure 5 below. Click on the new equilibrium position if manufacturers improved the efficiency of production.
Answer
If manufacturers improve the efficiency of production, then the supply curve would shift to the right – producers would be willing to increase supply at every price. The demand curve would not shift. So the curves to concentrate on are D1 and S3.
After the shift, producers are willing to supply more at every price, and consumers are willing to buy more if prices are lower. If prices stay at P1, but supply shifts to S3, there would be a surplus. In response, the equilibrium price falls from P1 to P2 and equilibrium quantity increases from Q1 to Q2.
There is a shift in supply to S3 and a movement along D1 to achieve the new equilibrium position, P2, Q2.
c) Figure 6 shows several demand and supply curves describing the market for tablet computers.
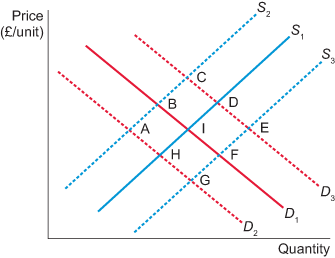
Study each of the following situations and consider the new equilibrium position, assuming in each case that the market is initially in equilibrium where the supply curve, S1, intersects the demand curve, D1 (point I in Figure 6). Match the new position to the label shown in Figure 6.
a.
A
b.
B
c.
C
d.
D
e.
E
f.
F
g.
G
h.
H
i.
I
The correct answer is b.
Answer
B is the correct answer. A rise in energy costs increases production cost and would be expected to decrease the amount supplied at every price. Supply shifts left to S2. As the demand curve does not shift, the reduction in supply means prices rise due to a shortage. The new equilibrium is at B.
a.
A
b.
B
c.
C
d.
D
e.
E
f.
F
g.
G
h.
H
The correct answer is d.
Answer
D is the correct answer. If consumers prefer to buy tablets, demand shifts right to D3. However, supply does not shift. At the initial equilibrium price, the increase in demand creates a shortage, so the price of tablets increases. At the higher price, firms are willing to supply more on the existing supply curve. The new equilibrium is at D.
a.
A
b.
B
c.
C
d.
D
e.
E
f.
F
g.
G
h.
H
The correct answer is f.
Answer
F is the correct answer. More entrants increase supply, shifting to S3. Demand does not shift, so the new equilibrium is at point F.