
1.2 Statistics in the classroom
Often, the classroom focus of statistics is on the first part of the OED definition, ‘The systematic collection and arrangement of numerical facts or data of any kind’, i.e. the numbers and the pictures. However, the second part of the definition emphasises that statistics is so much more than this – what are the numbers and pictures telling us? This is impossible to answer if we do not know the context.
Activity 2 Chocolate pie!
Interpret what this image shows you. Write down three sentences or questions related to this image.
Kellee to confirm if she’s happy with this pie-chart. Dale to amed title styling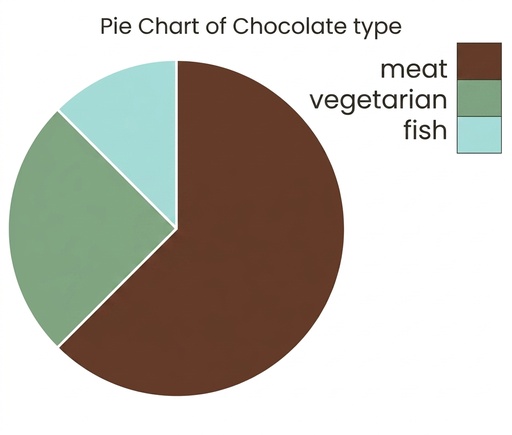
Comment
Perhaps you went straight to making a headline statement such as ‘the most popular chocolate type is milk’ or ‘about a quarter of all chocolate sales are of dark chocolate’.
Maybe you started asking questions about the data presented such as…
- What does this chart represent, e.g. favourite chocolate, sales of chocolate, most recently eaten chocolate type?
- How much data is represented here?
- Is all the data presented i.e. were there other categories that had a value of zero?
- Is the data for a particular place i.e. a town, city, country, worldwide?
Maybe you wrote comments or questions about the format…
- Why has a pie chart been used here?
- Labelling the slices rather than having a key would have made it clearer.
- The colours chosen should match the colour of the chocolate!
Whatever you wrote, you have just interpreted the data presented. Interpretation need not involve complicated calculations. Interpretation may involve asking questions that lead you to try and find out more about the data.