
1.3 Context
If you do not know the initial questions that were asked to collect the data, or how the data was collected – by whom, where, when, for what purpose – then how can you make reliable interpretations of the data?
Context is key to any data analysis. For your analysis to be meaningful and useful, it is important that your work with data is framed by the situation in which it is placed. Moreover, you need to think carefully about how you are going to collect the relevant data needed to give the answers to the questions you would like answered.
For learners to develop statistical thinking, they need to discuss the meaning behind their calculations and to interpret measures and graphs within relevant contexts. Statistics lessons must therefore involve more than just teaching techniques and methods.
In the next activity you will look at aspects to consider in the context of gathering information to find out if it is worthwhile opening a play park in a village. These aspects may include information such as age or number of children in a household but may also collect opinions of the residents in the village. You could imagine you are a member of the local council or community development committee in undertaking this task.
Activity 3 Play park investigation
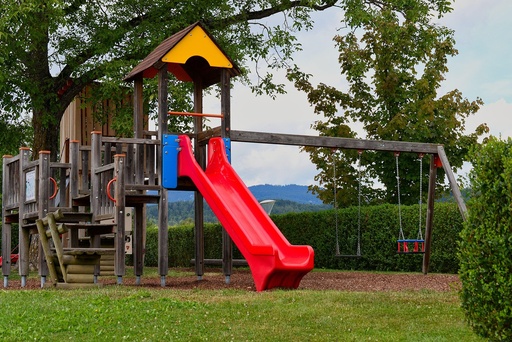
You want to find out if it is worthwhile opening a children’s play park in the village.
Below are some tasks that you might consider.
Place them in a logical order to help you get the information you need.
Comment
- Plan the questions to be asked and the type of data to be collected, e.g. age and number of children in a household, opinions.
- Plan who you are going to ask, everyone in the village or just some residents, and how you are going to contact them.
- Plan how you are going to organise the data you collect, e.g. table of age categories, number of children, written answers.
- Collect the data by surveying members of the local community.
- Process the data by performing calculations such as average number of children per household and producing graphs to visually communicate the data collected.
- Use the data to answer the initial questions, i.e. decide what the information tells you in the context of potential for opening the play park.
Steps 1 and 2 could go in either order. It is also common to place steps 3 and 4 the other way around. Often, we are so keen to collect the information that little thought goes into how we are going to organise it. However, if you think about the organisation of data first, your future steps will be much more focussed and efficient. In the steps above, note the emphasis on planning; the key part when undertaking any statistical project.