
2.2 The cycle
The PCAI cycle represents the statistical modelling process.
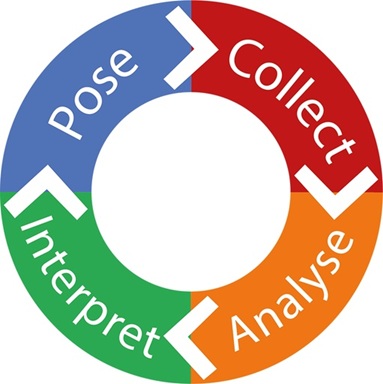
Watch the video to see how the PCAI cycle could be applied to our play park example from Activity 3. It also gives an overview of the complete process of undertaking a statistical project looking ahead to some of the elements covered later in this course.
All stages of a data handling project are connected. The early decisions about your question and your data will impact on the analysis and interpretation, and vice versa. In many secondary school curricula, there is a focus on producing accurate calculations and graphs (the third stage), but this is increasingly debated as technology can provide these for us.
Teaching statistical techniques, such as how to calculate an average, without teaching about the wider context in which the calculation sits, is meaningless. It is the whole process of the investigation itself, its relevance and applications, that makes statistics meaningful, rather than teaching snippets of seemingly irrelevant and unconnected skills for which there appears no apparent reason as to why or when this skill might be used.
For the rest of this section, you will focus on aspects that need to be considered when planning questions to be addressed in the investigation, the pose stage. The other stages of the data handling cycle are then looked at in more detail as you work your way through the course.
You’ll look at collecting and organsing data in more detail in Week 2. In Weeks 3 6, analysing data is covered in conjunction with interpreting results. That is, we look at calculating statistics and producing graphs in the context of different situations and how interpretation and discussion of results would follow from these representations of the data based on those contexts. Sometimes, statistics can be misleading, and this is covered in Week 7. Finally in Week 8 we look at the wider aspect of statistics; the future of statistics, big data and data science.
| PCAI | Week |
|---|---|
| POSE | Week 1 The data handling cycle |
| COLLECT | Week 2 Collecting and organising data |
| ANALYSE, INTERPRET | Week 3 Measures of location and dispersion |
| ANALYSE, INTERPRET | Week 4 Presentation of discrete data |
| ANALYSE, INTERPRET | Week 5 Presentation of continuous data |
| ANALYSE, INTERPRET | Week 6 Comparing data and interpreting results |
| INTERPRET | Week 7 Discussing statistics |
| Week 8 The future of statistics |