
1.1 Variability and sampling
There is an element of variability in the results of any statistics project because different samples contain different members of the population, so will lead to different results. This variability is known as the sampling error. It is not really an error or a mistake, just a way of recognising that a sample is being used to draw conclusions about the whole population.
In most situations you cannot even calculate a sampling error, since to do so you would have to know about the whole population (and then a sample would not be needed!). What you can do is estimate the sampling error and make choices that minimise it, say by avoiding introducing bias. For instance, in Week 1 you were looking at putting a new play park into a village. If you only ask people at the village school if there should be a new play park, it is very likely the outcome would be ‘yes’! This is a biased sample of users since some members of the population - the children - are systematically more likely to be asked than others.
Sample size also matters. Larger samples are likely to be more representative of a population however improvements tail off: a sample of 10 is much better than a sample of 1 but a sample of 30 is only a bit better than a sample of 20. There is a gain in statistical strength from using a larger sample that goes some way to offsetting the increase in time and cost associated with gathering the data.
Activity 2 Sample size
In Week 1, you looked to find out if it is worthwhile opening a children’s play park in a village. Author - I think this open line needs to be expanded upon a little. Do we need to add something like ‘Now you’re going to look at...’Use the information in Table 1 to answer the questions that follow.
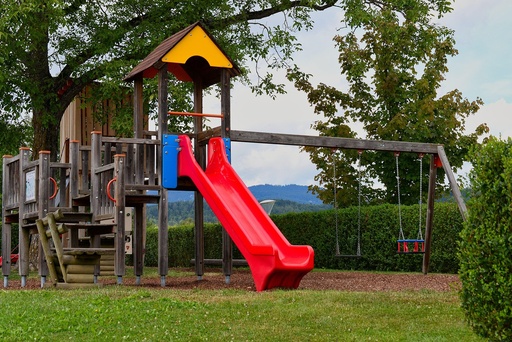
The data table below shows the distribution of ages (age demographic) of the population of village residents.
| Age (in years) | 0-4 | 5-10 | 11-17 | 18+ |
| Number of people | 73 | 107 | 0 | 1320 |
Use the information in Table 1 to answer the following questions:
What is the total population size for the village?
What percentage of the village are children (under the age of 18)?
If you are going to take a 10% sample of the residents of the village, how many people will be in your sample?
Answer
What is the total population size for the village?
Author: should we say how rthis is found, as we’ve done wirh the next answer1500
What is the total population size for the village?
This is found by adding all the numbers in the bottom row of the table. Author: insert answer
What percentage of the village are children (under the age of 18)?
12% is the answer. 180 of the residents of the village are children; 180 ÷ 1500 × 100 is one way of changing this number into a percentage of the whole population.
If you are going to take a 10% sample of the residents of the village to complete a questionnaire, how many people will be in your sample?
150 is the answer, 10% is equivalent to 1 person in every 10
In the final question in Activity 2, you calculated the number of people in a sample of size 10% of the village population. Think about context: Is this a suitable number of people to gain a representative perspective on the building of a play park? Is it manageable in terms of the time and cost needed to interview the residents? Are there any other considerations that should be made when taking your sample?
In the classroom, it is tempting to use 10% because calculating 10% of an amount is a ‘nice’ calculation. However, this may not always be appropriate for the context. From a recall point of view, it can be helpful to incorporate other elements of mathematical learning and practice into your statistics delivery by calculating some different percentage sizes for samples, such as 5%.