
1.2 Sampling in the classroom
Large data sets can be overwhelming and unwieldy for pupils in the classroom. Therefore, to allow them to focus on the key elements of working with the data, pupils are usually provided with much more manageable sized datasets. It is good for pupils to appreciate that, although they might be able to perform calculations on their complete dataset, this is not usually the case hence the need for sampling. If the data you use in the classroom come from large datasets, it is worthwhile showing pupils the original large dataset projected on the board; this can help them better understand why they need to practise working with a small amount of data. By way of an introduction to sampling, talk through how you selected the data you have chosen for them to work with.
There are several online dataset sources that can be adapted for use in the classroom from weather and climate data from the UK Met Office and NASA, to education and employment data or internet and social media usage data from the Office for National Statistics (ONS).
Below is a task that the authors have used many times in the secondary school classroom to help learners understand the notion of sampling.
Class task
Any teacher will know sweets enhance the concentration factor of pupils in a classroom!
Coloured sweets
Give each pupil a treat size box or packet of coloured sweets (sample) and ask them to use the sweets in their box or packet to make a judgement about the number or proportion of each colour of sweet made in each production run (population). Do they think the same number of each colour are produced?
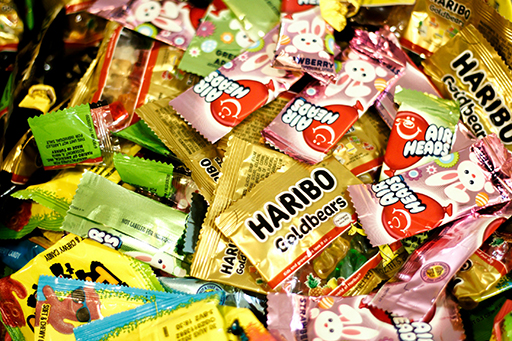
This task is a nice way to demonstrate sampling variability with each box/packet of sweets containing a sample of the total population of sweets produced. Predictions for the colour distribution in the total sweet population may be very different depending on what colours each pupil has in their box/packet. Pupils need to be able to justify their predictions based on their own sample; in statistics this justification is as important as the numerical results themselves.
Following individual predictions, combine the results of everyone in the group and make a new prediction for the whole sweet population colour distribution. This prediction is based on a larger sample therefore should be a better indicator of the overall sweet population. Do remember though that in statistics uncertainty is a key concept so, even with a much larger sample size, one cannot be certain of the characteristics of the overall population.
Some interesting facts:
- Blue is one of the most difficult food colouring dyes to make.
- Every year around 30,000 tonnes of some well-known colourful sweet brands are produced.
In the next section you will look at some common sampling methods. Although younger learners do not need to be able to take samples from datasets, it is important for learners to be aware that the data they are using may be a sample of a larger dataset and that sampling choices made will affect the reliability and applicability of their findings.