
1.7 Stratified sampling
In the initial definition of sample, we noted the word representative. Where possible, your sample should represent the population in terms of any relevant components or parts. If a geologist was going to sample some rock specimens from a cliff and they took all their specimens from the top of the cliff these would be unlikely to represent the rock types throughout the whole cliff. Cliffs are formed over millions of years with newer rock formations forming on top of older existing rock which, when viewed from the side, as in a cliff face, form layers or strata. So, if the geologist wanted a representative sample of rock specimens, they would need to pop on their climbing gear and take specimens from across the entire cliff face.
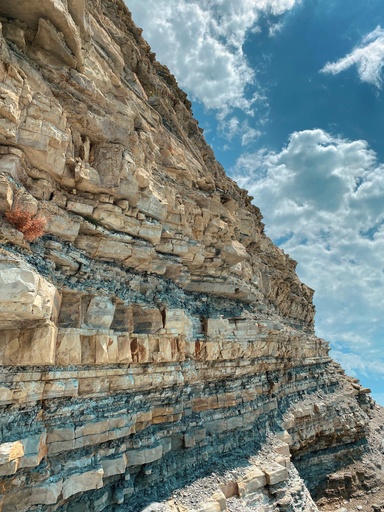
It is possible to identify ‘strata’ in many populations. In statistics, 'strata' refers to a group or 'layer' of the population.
Activity 5 Planning a stratified sample
Here is the village age demographic data for the children’s play park investigation.
| Age (in years) | 0 - 4 | 5 - 10 | 11 - 17 | 18+ |
| Number of people | 73 | 107 | 0 | 1320 |
There are 1500 residents in the village.
How many residents from each age group category would you interview to gain opinions about the plan to build a children’s play park in the village? Give your reasons.
Comment
Some points to consider:
Sample size:
How many residents in total do you plan to interview? You will need to think about what number is both representative and practical.
Proportions:
If you would like your sample to represent the age demographic of the village population then you would need to interview fewer children and more adults.
Ethics:
However, you would need to consider the ethical issues around interviewing children as mentioned in the ‘personal data’ section in Week 1.
Common sense: –
Considering practicalities and context in collecting data is always important. You may choose to over-sample those adults closest in age group to prospective users of the play park i.e. 17 – 20 year olds, or those adults who are parents of younger children.
Let’s assume we have a little more detail about the age demographic of the adults in the village population as shown in the table below. Notice this table of data is presented vertically instead of horizontally (as in Table 1). A seemingly small change such as this to the way in which data is presented can cause confusion with learners so is worth pointing out the change.
| Age group | Number of village residents |
| 0 – 16 | 180 |
| 17 – 20 | 96 |
| 21 – 40 | 630 |
| 41 – 60 | 414 |
| 61+ | 180 |
| TOTAL | 1500 |
To take a stratified sample of size 50 from the village residents you need to ensure the sample proportionally represents the village population in terms of age demographic.
So, you need to scale down the population by one thirtieth:
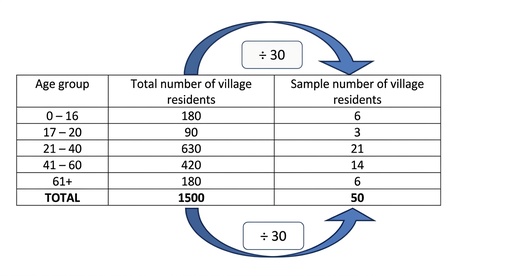
With parental consent, you may be able to collect information from the 6 residents in the 0 – 16 age group or, as we said in the previous activity, you may instead choose to ‘over-sample’ the 17 – 20-year-olds and interview 9 (=3+6) in this category.
You will notice all the sample numbers came out as a whole number of people here. Again, this is something that often happens in the maths classroom when introducing an idea so that more complicated values do not cloud the development of new understanding, in this case the idea of how to take a stratified sample. The next activity shows learners that things can be messier.
Activity 6 Taking a stratified sample
Here is the village age demographic data again for the children’s play park investigation.
| Age group | Number of village residents |
| 0 – 16 | 180 |
| 17 – 20 | 96 |
| 21 – 40 | 630 |
| 41 – 60 | 414 |
| 61+ | 180 |
| TOTAL | 1500 |
There are 1500 residents in the village.
If you would like to take a stratified sample that is 1% of the population of the village, how many residents in total would this be?
What issues do you foresee with the sample values for the number of residents in each age category in this instance?
Comment
So, you need 15 people in the sample. This is certainly a manageable number of residents to interview.
To get the number of residents in each age group, you need to scale down the population by one hundredth:
| Age group | Total number of village residents | Sample number of village residents |
| 0 – 16 | 180 | 1.8 |
| 17 – 20 | 90 | 0.9 |
| 21 – 40 | 630 | 6.3 |
| 41 – 60 | 420 | 4.2 |
| 61+ | 180 | 1.8 |
| TOTAL | 1500 | 15 |
In this sample, the number of people in each of our sample age ‘strata’ are not whole numbers (integers). How can we interview 6.3 21–40-year-olds?!
Clearly some rounding is needed but you need to ensure you still have a sample size of 15. Rounding to the nearest integer in the usual way will be sufficient here.
It is rare for sample values to result in integers, so a sensible approach needs to be taken to rounding the values. In some instances, where the calculated sample numbers end in ‘point 5’ you will end up with one too many items in your sample by following the usual rules of rounding. In this case, you could round one group up and the other group down to ensure the required sample size.
Having calculated how many residents are required in each category, random or systematic sampling is then used to select the individuals within each age group.
This method of selecting the proportion of items based on population characteristics is known as stratified sampling. There are not always obvious ‘strata’ by which to separate the population, and the choice of strata may also depend on the question(s) you are addressing. For example, we could stratify the adults in our play park example based on the number of children they have: 0, 1, 2, ....
The main advantage of using a stratified sample is the representativeness of the sample to the population, however another method of sampling is still then required to select individual items in each category.