
3.1 Larger amounts of data
If the amount of data you need to collect is larger or you expect repeated answers or results that will be the same, a list is not the most efficient collection method.
Activity 7 Some data collection
Part A. Roll a fair six-sided die 30 times and write down the results. You might have a die that you can use at home, or you can access this virtual dice roller [Tip: hold Ctrl and click a link to open it in a new tab. (Hide tip)] .
(‘Die’ is the singular of dice although it is now commonplace to use ‘dice’ as both singular and plural.)
Part B. Write down the names of everyone in your immediate family.
Comment
- How did you record your results?
- Did you consider what the outcomes might be before you started writing?
- Did you think about the types of data that would be produced?
- Here are two examples of set of results recorded for this activity.
Example solution 1
- a.4, 6, 2, 3, 3, 1, 6, 5, 3, 1, 1, 1, 5, 6, 2, 4, 2, 2, 3, 2, 5, 1, 4, 6, 1, 5, 3, 3, 6, 2
- b.Mum, Lilly, Aunt Elsie and Tiddles the cat.
You can see in this solution, that listing 30 digits (as in part (a)) can mean the information is difficult to interpret. Also, in part (b) a question might be raised about the definition of ‘immediate family’.
Example solution 2
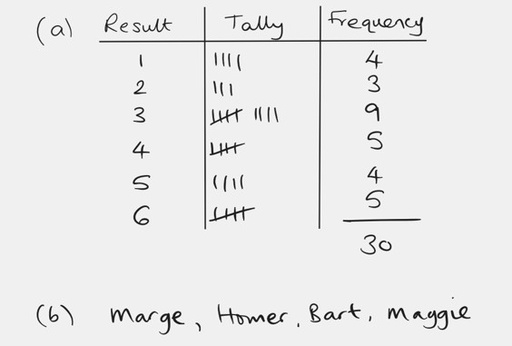
By thinking about the outcomes beforehand, this person has used an appropriate data capture sheet for part (a) of the activity. There are, of course, alternative ways of organising the collected data.
A tally chart is a good way of collecting data ‘as it happens’ where there are repeated occurrences of results.
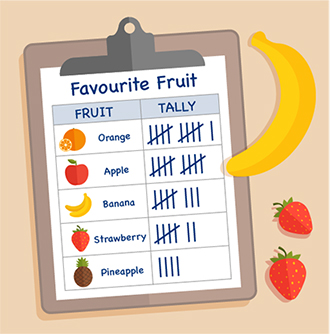
One of the simplest methods for collecting data is to use a tally chart, where marks (tallies) are grouped into bundles of five as shown in the previous activity. Children learn to count at a young age and recognising that grouping items can help them quickly total the full amount is a nice progression from the basic counting of individual items.
The tallies are counted for each result to gain the frequencies. Frequency in this context means the number of times something occurs, or ‘how many’. It is sometimes referred to as the ‘count’ of the data. The total frequency for the die activity is 30. The table shown in the activity is also known as a frequency table.
When both the data itself and the frequencies are represented by numbers, as in the die activity, learners sometimes confuse which is which. The data itself is the thing in which you are interested in knowing more about i.e. the number rolled on the die, whereas the frequency is how many times each data item appears.