
1.1 The Median – Caught in the middle
The average is often intended to be one number that summarises the set, sometimes called a summary statistic. If you ask pupils to choose a value that best represents a set of data, such as the heights of pupils in a class, they will often choose the one in the middle, the median.
The median of a set of numbers is the middle value when the data is written out in order, usually ascending i.e. from smallest to biggest, however, you will get the same value if the data is in descending order.
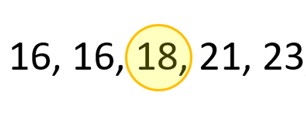
For example, in this set of five numbers, the middle value is the third value, which is 18.
But what if there is not a middle value or person, such as in the following image?
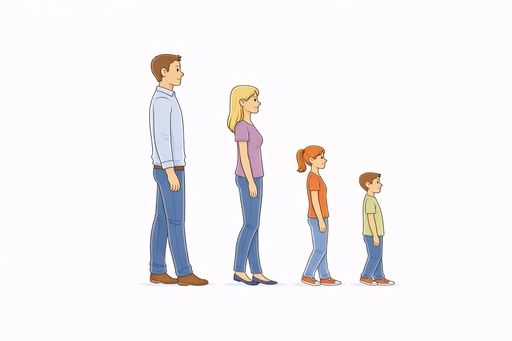
The median does not have to be one of the values in the data set, but it is a single value. In the image above, to find the median height of the four children, calculate the height which is halfway between the 2nd and 3rd children.
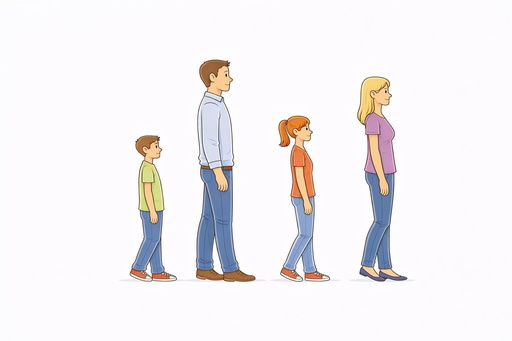
It is important to remember that the data needs to be sorted into numerical order before finding the median, though the median of a set of data is the same regardless of the order in which the data is presented. The median height of these four children does not change just because they are lined up differently.
Activity 3 Calculating the median
Calculate the median for each of these sets of numbers.
Set A: 3, 1, 4, 1, 5
Set B: 12, 16, 18, 24, 32, 44
Set C: 5.7, 5.15, 5.3, 5.05, 5.29
Answer
Remember the numbers should be placed in numerical order first.
Set A: 3
Set B: 21
Set C: 5.29
Did the inclusion of decimals in the previous activity cause you to think more deeply? Bringing mathematical topics together can create an extension task or an opportunity for revision. For example, to find the median in Set C, you needed to order decimals with different numbers of decimal places.
Activity 4 Understanding and fluency
Questions which bring different mathematical skills together can develop understanding and fluency, for instance:
Find the median of 2.5 hours, 180 minutes and 6000 seconds.
What might a learner find difficult, and what they might learn from this question?
Answer
The question involves different units as can often be the case with measurement data. In addition, one of the data items contains a decimal value, which can be tricky for hours and minutes.
Learners may simply order the three values and ignore the units. They may recognise the values need converting to the same units but not be able to decide which unit to use. Learners often struggle with converting time because one ‘whole’ is 60 sub-units for one minute and one hour, instead of the 100 they often encounter in the metric measurement system.
However, all these provide learning opportunities and a chance to further develop understanding and make connections between different areas of the mathematics curriculum. They also draw attention to the vital role of calibrating and ‘preparing’ data before analysing it.
Learners may learn pros and cons for choosing a common unit. For example, converting all these times to hours is not the most sensible option given the decimal/fractional value that would arise for 6000 seconds.
Here there are five pieces of data, so The median is in position
In a data set with an even amount of data items, say 8 items, the rule will indicate a position that is halfway between two data items,
Learners can find this method confusing at first. They may rightly question that a 4.5th value does not exist and need to connect it with the average of the 4th and 5th values. Learners may not see where the +1 comes from, and they can mix up the position (in third place) with the final answer (the median is 3). However, if a learner is comfortable working with this expression, it can be useful with large lists or sets of data.
Activity 5 Sqaure numbers and median
Imagine writing out the first 99 square numbers.
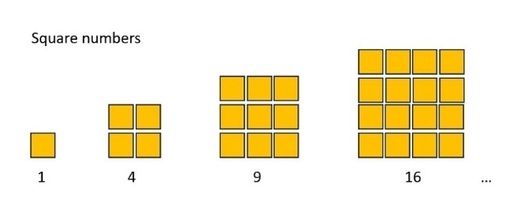
Which number would be the median?
Answer
As there are 99 numbers, n=99 and the median is in position
The square numbers are already in order, so we want the 50th square number:
Check:
Setting aside the 50th value (median) leaves 98 values, giving a balance of 49 on either side.