
1.2 The Mode – A popular statistic
In the averages video at the start of this week, three of the seven pupils had the same height so it seemed reasonable to consider whether using this height to represent the whole group would be sensible. Sometimes it is useful to use the value which is the most common or frequent in a data set as the summary statistic. This value is called the mode.

In French the word ‘mode’ means ‘fashion’; if something is fashionable we see it a lot.
The mode is the value or item with the highest frequency in a data set – that is, it is the most common or most popular response.
In the list of numbers 3, 4, 5, 5, 6, 6, 7, 7, 7, 7, 8 the mode is 7 because it occurs the most.
The mode is particularly useful when we are dealing with data that is not written with numbers.
For example, imagine that we asked a primary school class for their favourite animal.
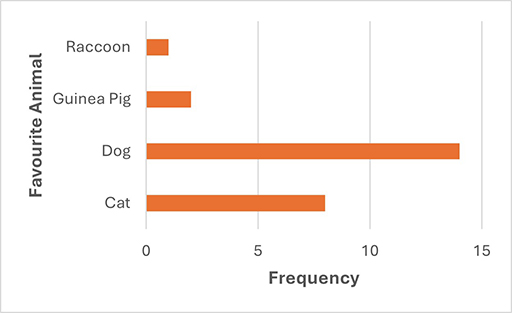
We can’t use the median as these animals do not have a fixed order, so there is no agreed ‘middle’. Dog is the modal answer since this response has the highest frequency. So, it is helpful to talk about the mode if the data is qualitative i.e. involves categories that we cannot order or add. Our elections are an example where we use the mode - the candidate with most votes wins.
Recall from the video the ‘modal answer’ is another way of saying the ‘answer which is the mode’. This small difference in language, modal instead of mode, can confuse or distract learners.
Activity 6 Calculating the mode
Calculate the mode for each of these lists of data.
Set A: 12, 12, 12, 12, 13, 14, 15, 15, 16, 17, 17
Set B: S, T, A, T, I, S, T, I, C, S
Set C: 31, 28, 31, 30, 31, 30, 31, 31, 30, 31, 30, 31
Set D: blue, red, green, purple, yellow, orange
Answer
Set A: 12
Set B: S
Set C: 31
Set D: there is no mode
Note. You could use a tally chart as seen in Week 2, to organise the frequency data here.
As you saw in Set D of Activity 6, there may not be a mode if all items appear the same number of times; there may also be more than one mode.
If there are two values or items which jointly have the highest frequency, we say that there are two modes, or the data is bimodal. It is possible to have more than two modes, but you need to judge whether it is sensible to do so. If there are more than two modes, we say the data is multimodal.
The bar chart in Figure 5 shows the frequency of shoe sizes sold. The tallest bars represent the highest frequencies, so the modal values can be found quickly. The modes are 7 and 9, this data is bimodal. Some learners might say the mode is 20 here given the two bars with a frequency of 20; this is where understanding which data is the contextual data, i.e. the shoe size, is important. It is helpful to include this information in the question, i.e. what is the modal shoe size? As opposed to just, what is the mode?
Dale to add fig decription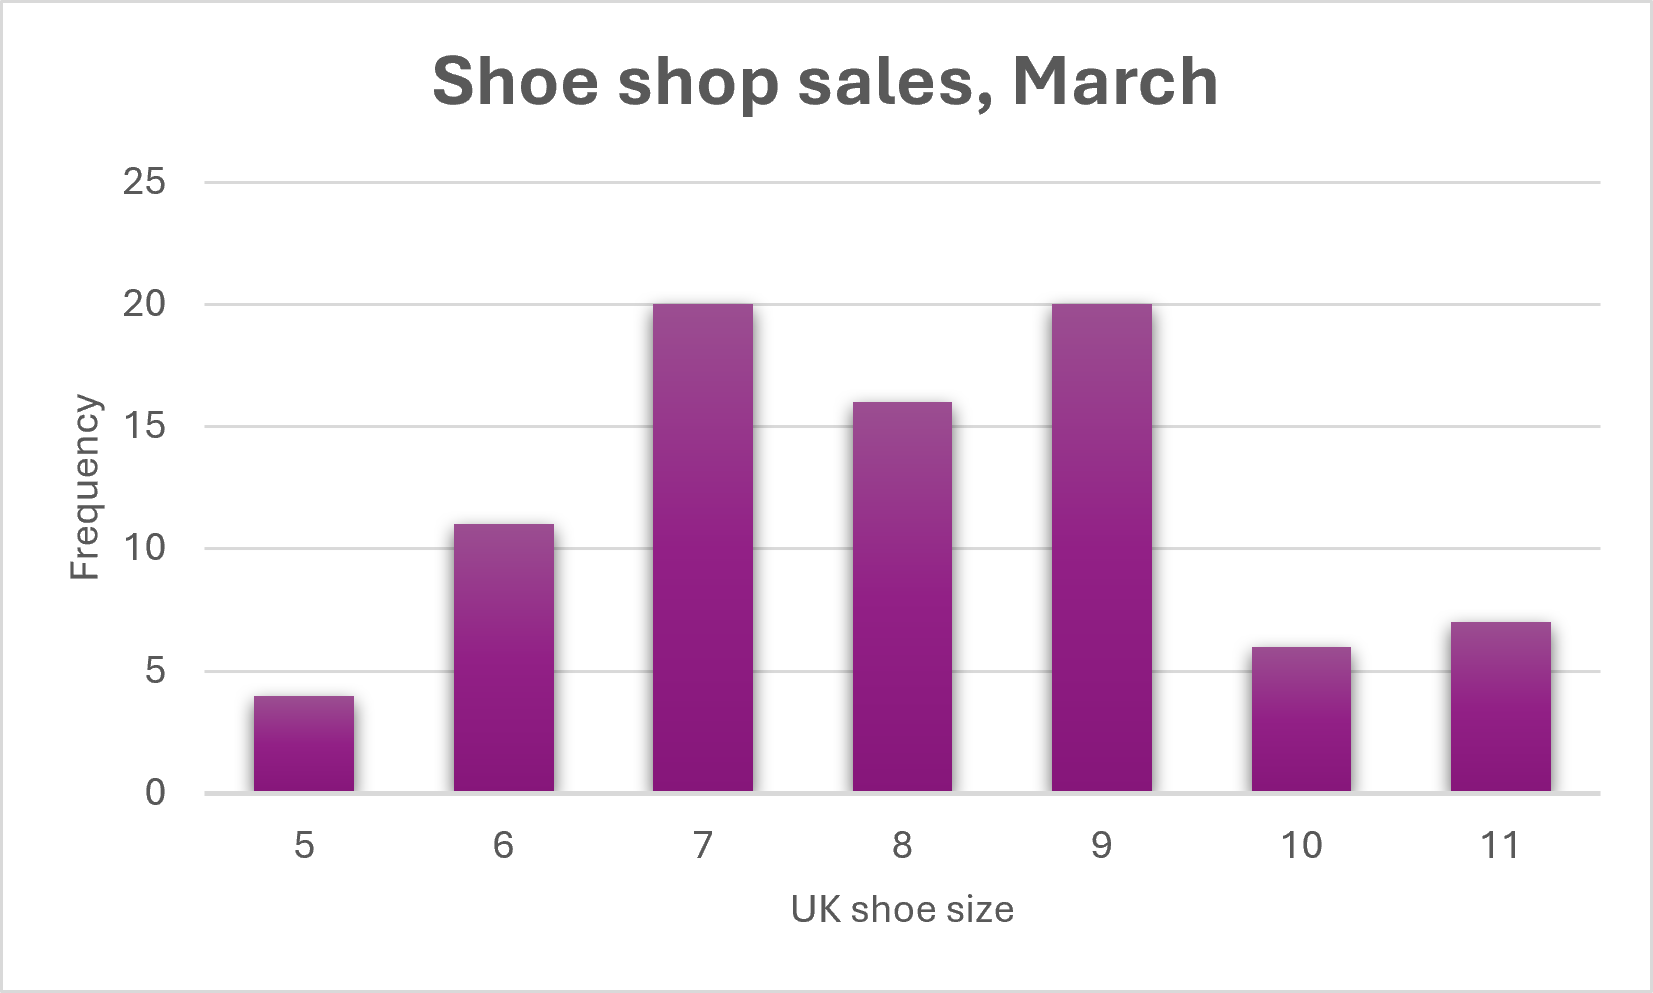
If a shop manager could only choose one summary statistic concerning the average shoe sizes sold, do you think they would prefer to know the mean, the median, or the mode of the sizes sold? Why?
The shop manager would probably prefer to know which sizes were sold the most for stock ordering purposes, although none of these results would be much use on their own; the manager would probably also want to know something about the distribution or how much variation or spread there was in the sizes of shoes sold.