
1.3 The Mean – It’s all about sharing
The mean (sometimes called the arithmetic mean) is what most people think of when they hear average.
There are different ways to think about the mean. One is to think of the mean as the outcome of sharing evenly. If three people dining together spent £10, £15 and £35 on lunch but split the bill equally, they would each be paying the mean. Watch this short video showing how ‘levelling out’ can be drawn as a picture or enacted with concrete resources such as multilink cubes or Cuisenaire rods.
Author - can you provide a sentence to lead into this video please.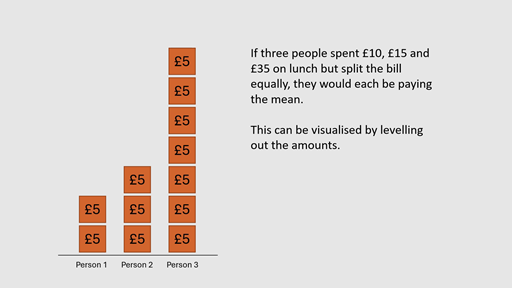
In effect then, the mean is sharing the total amount equally between the three people. To calculate the mean of a set of data, we add all the values together, and then divide by how many values there are.
For the numbers the mean is
From the data set 3,5,9,13 the mean is
Note the two different formats for presenting the calculations. Either is fine.
Activity 7 Calculating the mean
Calculate the mean for each of these sets of numbers. You can use a calculator as you see fit to support or check your work.
Set A: 2, 3, 3, 5, 7, 10
Set B: 8, 8, 8, 8, 8, 8, 8, 8, 8, 8
Set C: 14.5, 15.5, 16.5, 17.5
Set D: -6, 4, -11, 72, 10
Did you notice anything interesting? Were any of your results surprising?
Answer
Set A:
Set B:
Set C:
Set D:
With Set B being all 8s, did we need to add and divide them?
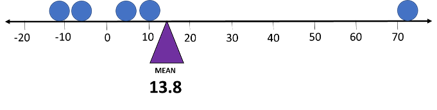
In Activity 7, were you surprised by the Set D answer? Four of the five numbers are smaller than the mean. The mean has been strongly influenced by one extreme value. If there are extremely small or large data values in a set, these can distort the value of the mean. In this situation it can be more useful or meaningful to consider the median of the data set instead.
Note that the mean and median only work for quantitative data - data such as numbers or quantities, that can be ordered, added or shared.
Another approach is to think about the mean as the fulcrum or balance point on a seesaw. Imagine the number line as an infinitely long, weightless beam. If we put an identical weight at each point corresponding to a number in our data set and wanted the seesaw to stay level, we would need to put the fulcrum at the point corresponding to the mean. Here’s an illustration for Set A: 2, 3, 3, 5, 7 and 10.
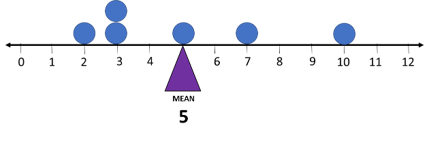
Picturing the mean like this isn’t always an efficient way to calculate an answer, but it can support understanding e.g. this diagram of Set D: -11, -6, 4, 10 and 72 shows the effect of the extreme value on the mean.
Classroom resource
This set of educational interactives provides a useful tool for visualising the mean and median. The mean and median are sometimes described as ‘measures of central location’ because they describe the data set by referring to a value which, in some way, refers to the centre of the data.
Center and Variability [Tip: hold Ctrl and click a link to open it in a new tab. (Hide tip)]
Dale to cehck if video clears fro embed.
These could be projected on a screen in a classroom to help with demonstration or used individually by students to explore the ideas of mean and median before formally learning about them.