
2.3 Other measures of dispersion
Just as the range is the difference between the largest and smallest values in a data set, the interquartile range is the difference between the largest (upper) quartile and the smallest (lower) quartile in a data set. Quartiles divide the data set into quarters.
In this data set of eight values divided into four equal pieces (quarters), the quartiles are represented by the yellow bubbles.

The middle bubble is the median, 20 (halfway between 19 and 21). The median is sometimes denoted as Q2.
Extending the earlier rule (for n values) that used the term for the median, we have:
- The term for the lower quartile (Q1)
- The term for the upper quartile (Q3)
Above, Q1 would be the term, i.e. the 2.25th position, which is 16.
Q3 would be the term, i.e. the 6.75th position. This is three quarters of the way between 25 and 31, the value 29.5, as shown in the diagram below.
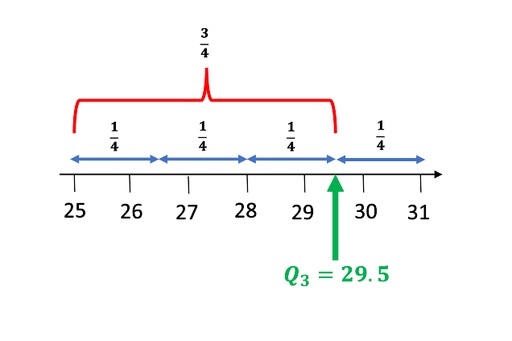
Confusingly, there are a few different ways for calculating the quartiles for discrete sets. Another approach is to take the medians of the lower and upper halves of the ordered data; this would still give Q1 as 16, but Q3 would be 28. Whichever method is used, you should be consistent in how you calculate the quartiles. For more information see the article in the further reading section.
The interquartile range is sometimes abbreviated to IQR.
IQR = Q3 – Q1
The IQR for the data set above is 13.5 (29.5 – 16) and represents the spread of the middle 50% of the data.
The following diagram is one way of representing the above data set. The sections representing the two measures of dispersion discussed here, range and interquartile range, are labelled.
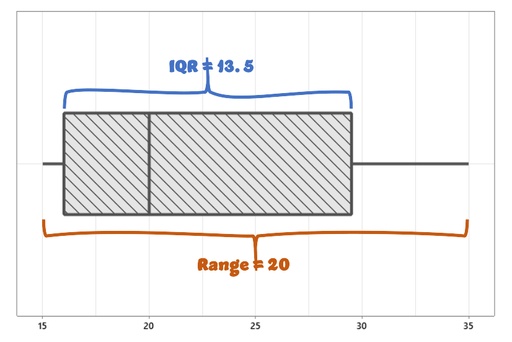
This diagram is known as a box plot, you will look at these in Week 5.
Another, much more in-depth, measure of dispersion is the standard deviation. This is not generally taught until post-16; it is mentioned here because in many contexts where statistics are routinely applied such as health and medical statistics, financial data and IT, the standard deviation is one of the most used measures of dispersion.
Standard deviation uses the distance of each data point from the mean for the calculation of the variation/spread. We will not go into the detail of calculating it here; the importance is to recognise that it is another way of measuring the dispersion of data.