2.4 Circles and spheres
Once the size of a star is known, it is possible to work out the size of any planet that transits in front of it. This is done simply by measuring how much light from the star is blocked by the planet.
But how much light is that? To work it out, you need to think about the cross-sectional area of a sphere.
Activity 1 Cross-sectional shapes
a.
Square
b.
Diamond
c.
Rectangle
The correct answer is a.
a.
Triangle
b.
Circle
c.
Square
The correct answer is b.
a.
Square
b.
Diamond
c.
Hexagon
The correct answer is c.
In terms of transits, it is important to know what a sphere looks like if it’s projected onto a flat surface. When we view spherical objects such as footballs and planets we see their cross-section, which is a circle.
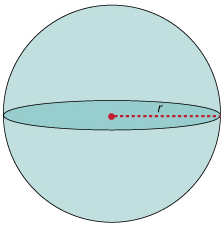
The term ‘cross-sectional area’ refers to the area of the shape that is the cross-section. So, the cross-sectional area of a sphere is the area of the circle we see. The radius of this circle, the distance from the centre to the edge, is just the same as the radius of the sphere (Figure 11).
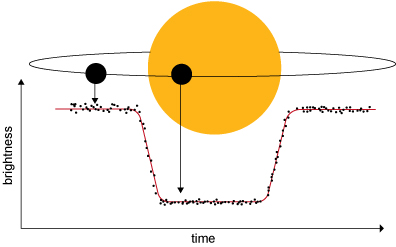
As with the pictures of the transits of Mercury and Venus in Figures 3 and 4, if you were close to the host star of a transiting exoplanet, you would see a bright circle of star with a smaller dark circle of planet on top of it. To work out how much of the bright star is ‘missing’, you need to know the areas of these two circles.
The host stars are incredibly far away though, so we can’t see these circles – all we can measure is the amount of light coming from the point of light that is the star. Figure 12 shows how the light coming from a star is reduced when a planet transits in front of it. This graph measuring the amount of light, with its particular shape, is called a light curve. The dip in the light curve tells us how much of the star’s light is blocked by the planet, from which we can calculate the relative areas of the two circles and hence the size of the planet.