2.1 Our closest stellar neighbour
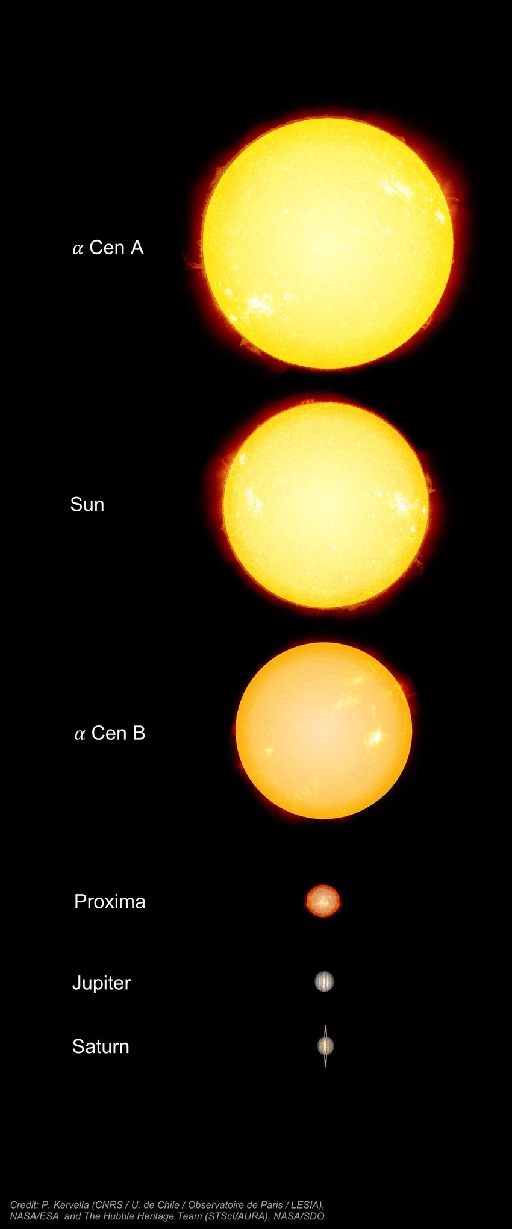
The closest star to the Sun is an M dwarf – a small, cool, red star called Proxima Centauri, or Proxima for short (Figure 1). It is very dim – despite its proximity to us it appears one hundred times fainter than could be seen with the naked eye. It is part of a triple-star system with the binary stars Alpha Centauri A and B. In recent years astronomers suspected that they’d found planets orbiting Alpha Centauri B, although unfortunately further studies have questioned their existence.
But what about Proxima Centauri? It’s a very favourable target for a planetary search. You’ve looked in previous weeks at the things that make it easier to detect a planet around a star, so now it’s time for a quick refresher of them.
Activity 1 What makes a planet easy to spot?
Can you remember what factors about a star make a planet easy to spot?
Is it easier to spot planets around a star that’s (a) nearby or (b) further away?
Answer
(a) nearby
Is it easier to spot planets around (a) large, high-mass stars or (b) small, low-mass stars?
Answer
(b) smaller, low-mass stars are usually better because the planets create a greater orbital wobble or block relatively more of the star’s light in transit. However, lower-mass stars are also fainter, so if they aren’t near enough it can make things difficult.
If you want to find a small planet, what kind of star would you choose to observe?
Answer
Small, cool, nearby stars are best because there is enough light to get a precise measurement and the signal from the planet will be relatively large.
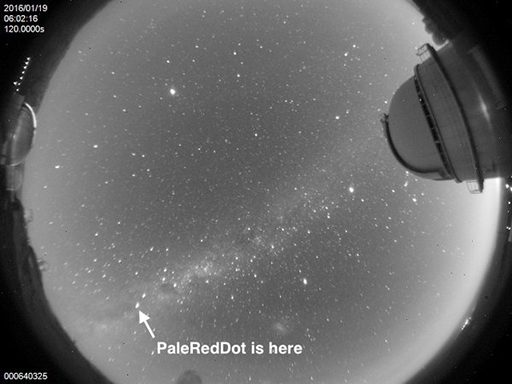
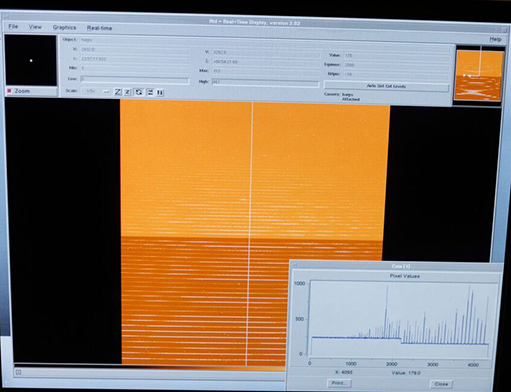
Because Proxima Centauri is small but close by, it is a good target for a radial velocity (RV) search. The transit method only works if the system is lined up perfectly, so the planet passes between us and the parent star. The RV method works for almost all orbital orientations, as you saw in Week 3. So, the Pale Red Dot project was born. Starting in January 2016, astronomers used the HARPS instrument mounted on the La Silla telescope in Chile to observe Proxima Centauri (Figure 2) and measure any tiny shifts in the positions of absorption lines in its spectrum (Figure 3).