

4 Overuse of antibiotics
Central to the growing problem of antibiotic resistance is the increasing demand for antibiotics. In the next activity, you will look at the relationship between antibiotic use and antibiotic resistance across Europe.
Activity 3 Antibiotic use and antibiotic resistance in Europe
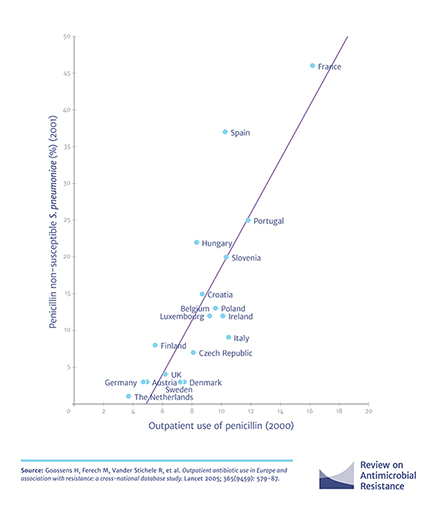
First, look at Figure 4. The x-axis (horizontal) shows a measure of penicillin use in the year 2000 (given as the defined dose per 1000 inhabitants daily – DID. You do not need to know how this is calculated). The y-axis (vertical) shows the proportion of Streptococcus pneumoniae infections that were penicillin-resistant in the year 2001. Each point on the graph represents a country.
Now answer the following questions, based on the data in Figure 4.
- Which country had the lowest antibiotic use?
- Which country had the highest antibiotic resistance?
Answer
- The Netherlands (furthest to the left of the x-axis).
- France (highest on the y-axis).
- Does the graph show a correlation between antibiotic use and antibiotic resistance? A correlation simply means that there is a relationship between two sets of data (i.e. the antibiotic use on the x-axis and the antibiotic resistance on the y-axis). For example, as the value of X, increases, the value of Y also increases.
Answer
Yes, there is a positive correlation between antibiotic use and antibiotic resistance. As antibiotic use increases, so does the proportion of antibiotic-resistant infections.
Next, you will consider the factors that promote the overuse of antibiotics and encourage the development and spread of antibiotic resistance.