

2 Ageing forecasts by country
The United Nations produced a world chart showing the percentage of the populations of individual countries aged 60 years or older for 2012. They then provided a forecast for the year 2050 (Figures 3a and 3b).
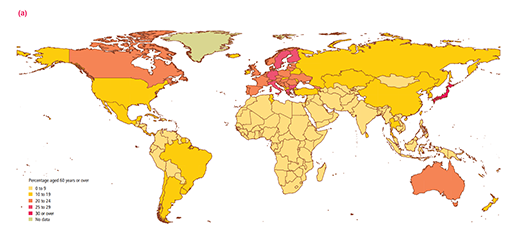
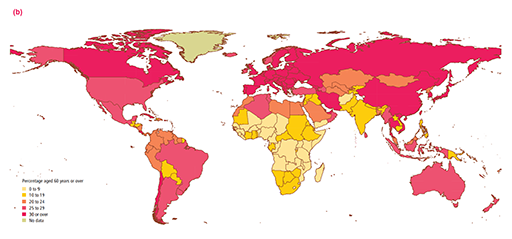
Activity 2 Ageing statistics for individual countries
Using Figures 3a and 3b, answer the following questions by choosing the one correct option for each.
a.
0–9%
b.
10–19%
c.
20–24%
d.
25–29%
e.
No data
The correct answer is c.
a.
0–9%
b.
10–19%
c.
20–24%
d.
30% or over
e.
No data
The correct answer is d.
a.
0–9%
b.
10–19%
c.
20–24%
d.
30% or over
e.
No data
The correct answer is a.
a.
Africa and the Middle East
b.
Australia and Indonesia
c.
India and the Middle East
d.
North and South America
e.
Russia, China and Europe
The correct answer is e.
Here you have seen that the projected figures indicate that the populations of the developed world may rise by 30% or more. The proportions of the ageing populations in these countries are also expected to rise. So, what research is being carried out on the effects of ageing?