5 Forming planets: using models
In the previous section, you met the ‘coefficient of restitution’, ‘translational energy’ (or kinetic energy) and ‘rotational energy’.
The ‘coefficient of restitution’ can take values between 0 and 1 where:
- 0 means a perfectly inelastic collision where the particles have no relative velocity after the collision and they stick together
- 1 means a perfectly elastic collision, where the particles move away from each other after the collision as fast as they were moving towards each other before it.
Equation 1 shows the ratio of final relative velocity to initial relative velocity as the coefficient of restitution.
In this case, highly inelastic collisions are key to understanding planet formation. As you saw in Video 4, these collisions show that the particles behave more like crashing cars than snooker balls!
Now look at Table 3 which lists the data obtained from a collision experiment (precise to up to 6 significant figures).
| Velocity before collision | Coefficient of restitution | ||||
|---|---|---|---|---|---|
| 0.394340 | +/- | 0.005249 | 0.312340 | +/- | 0.007026 |
| 0.404975 | +/- | 0.005254 | 0.430552 | +/- | 0.008426 |
| 0.417616 | +/- | 0.005249 | 0.472011 | +/- | 0.010388 |
| 0.418179 | +/- | 0.006828 | 0.527789 | +/- | 0.013723 |
| 0.335328 | +/- | 0.004141 | 0.354709 | +/- | 0.006535 |
| 0.418685 | +/- | 0.004471 | 0.870707 | +/- | 0.012637 |
You can see that, to 2 significant figures, the velocities before the collisions range between 0.34 m/s and 0.42 m/s.
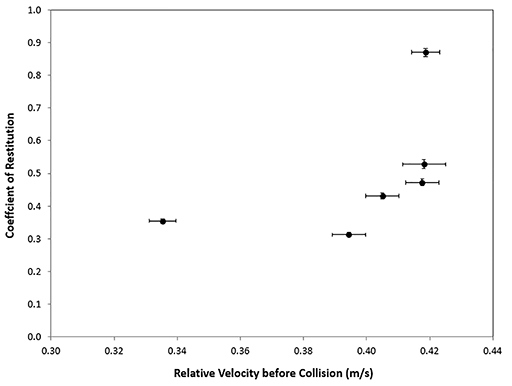
The final velocities achieved in the experiment gave the results for the coefficients of restitution by using Equation 1 and the data in the experiment. The coefficients of restitution have therefore been calculated from the values of the final velocities and, to 2 significant figures, they range between 0.31 and 0.87. Figure 6 shows the data from Table 3 as a graph.
Note that the horizontal lines are the ‘error bars’. These correspond to the +/- values in Table 3.
-
Can you deduce a relationship between the relative velocity before collision and the coefficient of restitution from the graph?
-
It seems that, for lower values of relative velocity greater than the collision (0.34 m/s), the coefficient of restitution also takes lower values (0.3).
This may be constant for values of relative velocity between the collision between 0.34 m/s and 0.40 m/s.
However, as the relative velocity values after the collision increase beyond 0.40 m/s, the values of the coefficient of restitution increase quickly up to 0.90.
Now complete Activity 7.
Activity 7 Calculating the final velocities of the particles
Calculate the values of the final velocities to 3 significant figures in the table below. (Hint: look at Equation 1 and rearrange it in terms of the final velocity.)
| Initial velocity (m/s) | Coefficient of restitution | Final velocity (m/s) |
|---|---|---|
| 0.394 | 0.312 | |
| 0.405 | 0.431 | |
| 0.418 | 0.472 | |
| 0.418 | 0.528 | |
| 0.335 | 0.355 | |
| 0.419 | 0.871 |
Answer
| Initial velocity (m/s) | Coefficient of restitution | Final velocity (m/s) |
|---|---|---|
| 0.394 | 0.312 | 0.123 |
| 0.405 | 0.431 | 0.174 |
| 0.418 | 0.472 | 0.197 |
| 0.418 | 0.528 | 0.221 |
| 0.335 | 0.355 | 0.119 |
| 0.419 | 0.871 | 0.365 |
You will have found that the final velocity of the colliding objects is less than the initial velocity. The coefficient of restitution is also greater than zero which means that these particles don’t stick together.
Next you will complete the end-of-week quiz.

