

2.2.1 Analysis of ethanol using IR spectroscopy
Ethanol is a relatively small molecule with only four types of bond.
Thinking back to the structure of ethanol, can you list the four types of bond present?
The four types of bond in the structure of ethanol are:
- C–O
- O–H
- C–H
- C–C
where C represents carbon, O represents oxygen, and H represents hydrogen.
The simplicity of the ethanol molecule means that the IR spectrum is relatively easy to measure and so it is possible to identify ethanol in a complex sample such as a breath sample containing water and other organic compounds.
The IR spectrum of ethanol is shown in Figure 9 below.
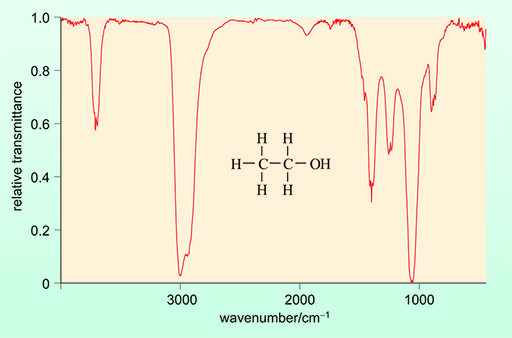
An IR spectrometer that is being utilised to detect ethanol – and therefore alcohol – will do so based on the absorbance of a specific peak. This is usually the absorption band at a wavenumber of approximately 3000 cm-1. The intensity of this signal in that region will be directly proportional to the ethanol concentration.
This absorbance is attributable to the C–H bond of ethanol. The absorbance of light is directly proportional to the concentration of ethanol and can therefore be used for quantification.
Can you remember one of the limitations of the breathalyser test you looked at previously?
The breathalyser test – based on the potassium dichromate solution – could possibly identify a false positive, in other words give a positive result for ethanol even if no alcoholic drinks have been consumed.
Unfortunately, using an IR spectrometer does not overcome this problem either. A compound called acetone is produced by the human body in cases of ketosis (acidosis) which is common if the test subject has not eaten for some time. Furthermore, diabetes mellitus is a very common disease affecting blood sugar levels, and ketosis can be a common manifestation of the disease.
Acetone also absorbs at 3000 cm-1. This means that, if it is present, it will interfere with the measurement of ethanol, leading to a false positive.
In reality, this is not a problem practically, as acetone has other functional groups which give rise to characteristic peaks in its IR spectrum which would not be present in the IR spectrum of ethanol. This means that the presence of acetone can easily be identified and its concentration measured from an alternative peak.
How would this allow you to measure the concentration of ethanol?
If both acetone and ethanol are present in a test sample, then the absorbance at 3000 cm-1 will be attributable to both substances. If you are able to work out the concentration of acetone based on an alternative peak, the value obtained for this concentration could be subtracted from the total concentration calculated from the peak at 3000 cm-1. This would then yield a value for the concentration of ethanol alone.
Portable IR spectrometers are now also commonly used for roadside breath testing, and furthermore this technology has also been integrated with fuel cell technology allowing for two analytical tests to be performed simultaneously.