Skip to content
Skip to main content

About this free course

Download this course

Share this free course

An introduction to minerals and rocks under the microscope

Start this free course now. Just create an account and sign in. Enrol and complete the course for a free statement of participation or digital badge if available.

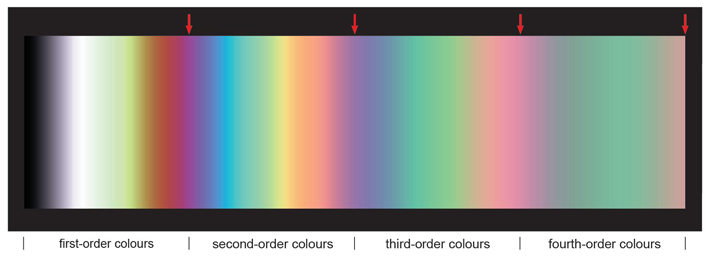
Figure 33 The Michel-Levy chart. Interference colours viewed through a quartz wedge, increasing in thickness from left to right, as viewed between crossed polars. The colours are divided into different orders (see text), separated by pinkish-purple bands, as indicated by the red arrows along the top.

 2.2.5 Interference colours