

1 An introduction to ageing
Human beings are complex life systems. As you get older, you experience the effects of ageing. But what is the ageing experience?
There are certain ‘hallmarks of ageing’. Figure 1 is based on research into the ageing process using insects as models, but the process equally applies to human beings.
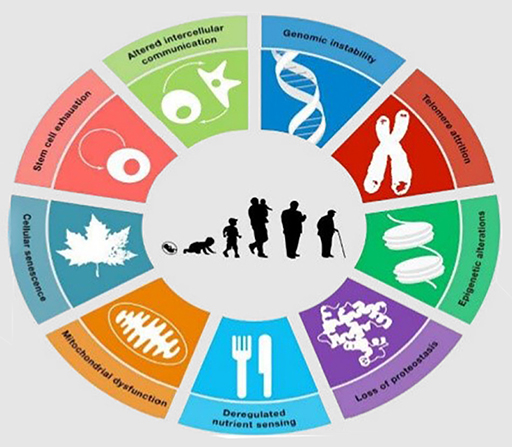
There are many complicated processes going on here, but you don’t need to know the details. The most apparent hallmark of ageing is ‘genomic instability’. Here, the effect of unstable genomes could reduce life expectancy. All of the ‘hallmarks of ageing’ indicate a reduction in life expectancy. So how does this affect human beings in the 21st century?
You probably know that the population of the world is increasing and that older people are living longer. This is reported in the news almost every day. There are constant worries in western society about how to support our ageing populations, from providing care homes and long-term medical care (which can be very expensive) to state pensions. As a direct result of statistical analysis, most people are well aware of these financial implications; from reduced life insurance premiums to an increase in retirement age.
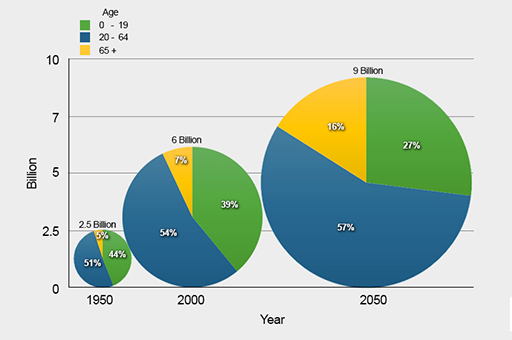
Figure 2 indicates how the population of the world changed between 1950 and 2000, and how it is anticipated to increase by 2050. This chart was produced by the Population Division of the Department of Economic and Social Affairs of the United Nations in 2005, so it is already out of date.
Now, using the data in Figure 2, complete Activity 1.
Activity _unit3.2.1 Activity 1 The ageing population from 1950 to 2050
Answer the following questions by choosing the one correct option for each.
a.
It has increased from 44% to 39%.
b.
It has decreased from 44% to 39%.
c.
It has stayed the same.
d.
It has increased from 44% to 57%.
e.
It has decreased from 44% to 27%.
The correct answer is b.
a.
7%
b.
15%
c.
16%
d.
27%
e.
39%
The correct answer is d.
a.
It is set to increase from 51% to 57%.
b.
It will decrease from 57% to 51%.
c.
It is predicted to stay the same.
d.
It is set to increase from 51% to 54%.
e.
It will decrease from 54% to 51%.
The correct answer is a.
a.
It will increase from 5% to 7%.
b.
It will decrease from 7% to 5%.
c.
It will stay the same.
d.
It will increase from 5% to 16%.
e.
It will decrease from 16% to 5%.
The correct answer is d.
a.
0–19
b.
20–64
c.
65+
d.
None
The correct answer is a.
You can now appreciate not only how the world’s population has changed between 1950 and 2000, but also how it is anticipated to change by 2050. The following statistics are given relative to the world’s population for the year concerned.
- Between 1950 and 2000, the age group 0–19 decreased from 44% to 39%. By 2050, it is anticipated that this age group will decrease further to 27%.
- Between 1950 and 2000, the age group 20–64 increased from 51% to 54%. By 2050, it is anticipated that this age group will increase further to 57%.
- Between 1950 and 2000, the age group 65+ increased from 5% to 7% and is anticipated to increase further to 16% by 2050.
You have looked at how the world’s population is expected to change between 1950 and 2050. Next, you will look at these changes as they impact on individual countries.