3 Using flowcharts to describe a task

Application programs are designed to perform specific tasks. These tasks range from the relatively simple to the extremely complex. In this section you will look at what is involved in planning a program to perform some simple tasks.
There are many ways of writing an application program. However, one common starting point is to break down the overall task, or objective of the program, into smaller tasks. One technique to achieve this is to draw a flowchart, showing each of these smaller steps on the way to delivering the task.
In order to write a program, the task the program will perform has to be first written as a list of actions. The actions have to be given in an order that will ensure the task is carried out successfully.
Activity 1
Write down, in order, the list of actions you would have to carry out to boil some water in an electric kettle.
Discussion
You may have come up with the following list of actions:
- take lid off kettle
- turn on tap
- fill kettle with water
- monitor water level and turn off tap when correct
- put lid on kettle
- plug kettle in
- switch on kettle.
Your list may be different from this one. For example, you may pour the water into the spout without taking the lid off, or the method of supplying power to the kettle might not use a switch. This doesn’t matter. What is important is that you can see how even a very simple task can be described as a series of actions, and that these actions must be given in a particular order for the task to be carried out successfully. In my answer, for example, it would be impossible to carry out the action to put the lid on the kettle if it hadn’t been taken off earlier in the sequence of actions.
Consider a very simple set of electronic scales. These scales have an on/off switch, but no other input buttons, and a display to show the weight of the object in the scalepan in grams.
Activity 2
Write down, in order, the list of actions that the computer inside the scales has to carry out in order to show an object’s weight on the display.
Discussion
The computer has to:
- accept data from the sensor that measures the displacement of the scalepan
- transform the data from the sensor into data for the display
- send the display-formatted data to the display.
The list of actions in the comment to Activity 2 can be shown diagrammatically in a type of diagram called a flowchart. Figure 1 shows how you could write this sequence of actions as a flowchart.
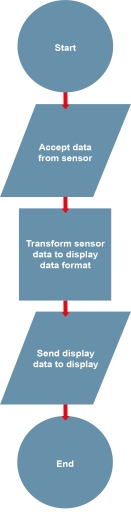
The shapes of the symbols used in flowcharts are significant. Flowcharts are a common language used to communicate processes and it is important to be consistent in their use. This flowchart uses three different symbols to show:
- the start/end points of the process
- data input or output
- a process to be carried out.
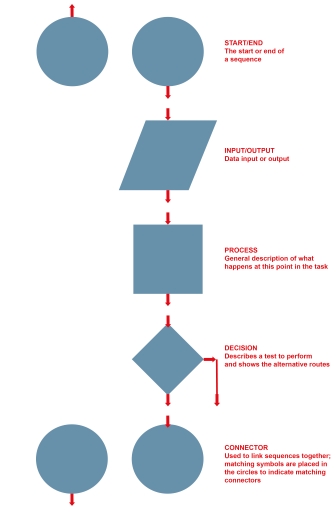
Figure 2 defines these symbols. It also defines an additional symbol that shows a decision being made, and another for showing connectors.
In flowcharts, lines are used to connect symbols together, and arrows on these lines indicate the order in which tasks are carried out. You can see this in Figure 1.
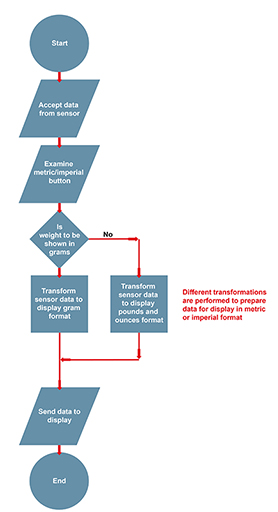
The next example incorporates a decision box. It involves a slightly more complex set of electronic scales: they have one additional button on the front that allows the user to select whether the weight is displayed in grams or in pounds and ounces. A flowchart incorporating this choice of display format is shown in Figure 3. It uses the decision box to make a choice about which piece of the program will be run. There are two exit routes from the decision box; each route is called a branch. If the user has requested that the weight should be displayed in grams, the Yes branch is followed so that the sensor data can be transformed to gram format. If the user has requested that the weight should be displayed in pounds and ounces, the No branch is followed to transform the sensor data to pounds and ounces instead. Note that once the translation to the selected output format is complete the branches of the flowchart come together again and the ‘send to display’ part of the task is run regardless of which branch was taken earlier in the program.