4.1 Drawing pie charts
The best way to understand the steps involved in drawing a pie chart is to watch the worked example in the video below.

Transcript
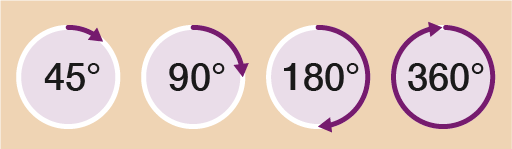
When you draw a pie chart, you're splitting a circle into a number of different sections of different sizes, depending on the data you're given. A full circle has a total of 360 degrees. A quarter of a circle is 90 degrees, and a half circle is 180 degrees.
Let's create a pie chart to show you the steps involved in drawing one. This table shows some information about the number of clients at a beauty salon and what treatments they had. If you want to draw a pie chart, you need to know how many degrees of the circle to allocate for each treatment.
To do this, you need to divide 360 degrees by the number of clients. This is because you want to share the full circle, 360 degrees, equally between each of the clients. Each person is represented by a certain number of degrees.
In this example, the total number of clients equals 24 + 16 + 15 + 5, which equals 60. 360 divided by 60 equals 6, so each client gets six degrees of the circle.
Now that you know how many degrees each treatment type is worth, you can draw the pie chart. First, you need to draw a circle. Next, draw a line from the centre of the circle to the top of the circle. This will be the line that you start drawing your slices from. Now, use a protractor to measure the correct angles and draw the pie chart.
It should look something like this. Now, have a go at drawing a pie chart for yourself.
Now have a go at drawing a pie chart for yourself.
Activity 7: Drawing a pie chart
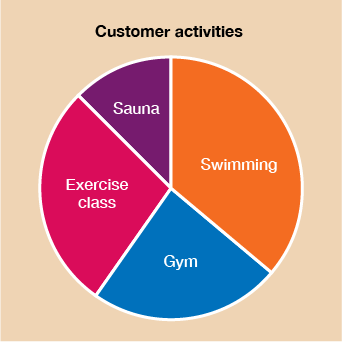
A leisure centre wants to compare which activities customers choose to do when they visit the centre. The information is shown in the table below. Draw an accurate pie chart to show this information. You may hand-draw your pie chart or create it using a computer package.
| Activity | Number of customers |
|---|---|
| Swimming | 26 |
| Gym | 17 |
| Exercise class | 20 |
| Sauna | 9 |
Answer
Firstly, work out the total number of customers:
26 + 17 + 20 + 9 = 72
Now work out the number of degrees that represents customer:
360˚ ÷ 72 = 5˚ per customer
| Activity | Number of customers | Number of degrees |
|---|---|---|
| Swimming | 26 | 26 × 5 = 130˚ |
| Gym | 17 | 17 × 5 = 85˚ |
| Exercise class | 20 | 20 × 5 = 100˚ |
| Sauna | 9 | 9 × 5 = 45˚ |
Now use this information to draw your pie chart. It should look something like this:
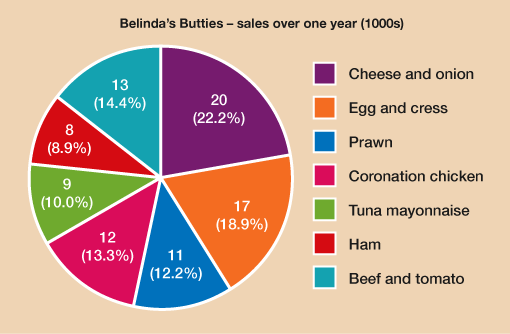
- The table below shows the sandwich sales over one year for sandwich company, Belinda’s Butties. Draw a pie chart to illustrate the data. You may hand-draw your pie chart or create it using a computer package.
| Sandwich Type | Sales (000s) |
|---|---|
| Cheese and onion | 20 |
| Egg and cress | 17 |
| Prawn | 11 |
| Coronation chicken | 12 |
| Tuna mayonnaise | 9 |
| Ham | 8 |
| Beef and tomato | 13 |
Answer
Firstly, work out the total number of sandwich sales:
20 + 17 + 11 + 12 + 9 + 8 + 13 = 90 (000s)
Now work out the number of degrees that represents each sale:
360 ÷ 90 = 4˚ per sale
| Sandwich Type | Sales (000s) | Number of Degrees |
|---|---|---|
| Cheese and onion | 20 | 20 × 4 = 80° |
| Egg and cress | 17 | 17 × 4 = 68° |
| Prawn | 11 | 11 × 4 = 44° |
| Coronation chicken | 12 | 12 × 4 = 48° |
| Tuna mayonnaise | 9 | 9 × 4 = 36° |
| Ham | 8 | 8 × 4 = 32° |
| Beef and tomato | 13 | 13 × 4 = 52° |
Now use this information to draw your pie chart. It should look something like the one below.
Now that you can accurately draw a pie chart, it’s time to look at how to interpret them. You won’t always be given the actual data, you may just be given the total number represented by the chart or a section of the chart and the angles on the pie chart itself. It’s useful to know how to use your maths skills to work out the actual figures.
Here’s a reminder of the degrees of a circle which will be useful when you come to read from pie charts.