

7 Probability
You will use probability regularly in your day-to-day life:
- Should you take an umbrella out with you today?
- What are the chances of the bus being on time?
- How likely are you to meet your deadline?
Probability is all about how likely, or unlikely, something is to happen. When you flip a coin for example, the chances of it landing on heads is or 50% or 0.5 (do you remember from your work in Session 1 how fractions, decimals and percentages can be converted into one another?).
The probability, or likelihood, of an event happening is perhaps most easily expressed as a fraction to begin with. Then, if you want to express it as a percentage or a decimal you can just convert it.
Let’s look at an example.
Example: Chocolate probability
A box of chocolates contains 15 milk chocolates, 5 dark chocolates and 10 white chocolates. If the box is full and you choose a chocolate at random, what is the likelihood of choosing a dark chocolate?
Method
There are 5 dark chocolates in the box. There are 15 + 5 + 10 = 30 chocolates in the box altogether.
The probability of choosing a dark chocolate is therefore:
=
You could also be asked the probability of choosing either a dark or a white chocolate. For this you just need the total of dark and white chocolates:
5 + 10 = 15
The total number of chocolates in the box remains the same so the likelihood of choosing a dark or a white chocolate is:
=
You could even be asked what the likelihood is of an event not happening. For example, the likelihood that you will not choose a white chocolate. In this case, the total number of chocolates that are not white is 15 + 5 = 20.
Again, the total number of chocolates in the box remains the same and so the probability of not choosing a white chocolate is:
=
Now have a go yourself by completing the short activity below.
Activity 17: Calculating probability
You buy a packet of multi-coloured balloons for a children’s party. You find that there are 26 red balloons, 34 green balloons, 32 yellow balloons and 28 blue balloons.
You take a balloon out of the packet without looking. What is the likelihood of choosing a green balloon?
Give your answer as a fraction in its simplest form.
At the village fete, 350 raffle tickets are sold. There are 20 winning tickets. What is the probability that you will not win the raffle?
Give your answer as a percentage rounded to two decimal places.
Answer
There are 34 green balloons. The total number of balloons is 26 + 34 + 32 + 28 = 120.
The likelihood of choosing a green balloon is therefore:
= in its simplest form.
If there are 20 tickets that are winning ones, there are 350 − 20 = 330 tickets that will not win a prize.
As a fraction this is:
To convert to a percentage, you do 330 ÷ 350 × 100 = 94.29% rounded to two d.p.
You sometimes need to calculate the probability of more than one event occurring. In this case, the events might be:
independent – which means that the outcome of one event does not affect the other
dependent – which means that the outcome of one event does affect the other.
In either case, you can use tree diagrams or tables to help you to picture and solve these problems.
Example: Gender probability
If a couple has two children, the gender of the first child will not affect the gender of the second child. All possibilities can be shown in the form of a table:
B = boy
G = girl
| HighlightedFirst child | |||
|---|---|---|---|
| HighlightedB | HighlightedG | ||
| Highlighted Second child | HighlightedB | BB | GB |
| HighlightedG | BG | GG | |
Alternatively, it can be shown as a tree diagram:
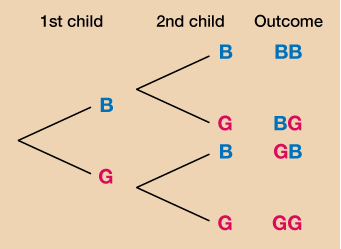
Both the table and the tree diagram show that there are four possibilities:
BB – boy then another boy
BG – boy then a girl
GB – girl then a boy
GG – girl then another girl
Out of the possibilities there is 1 in 4 or (1 quarter/25%) chance of having 2 boys or 2 girls.
There is a 2 in 4 or (/1 half/50%) chance of having one child of each gender.
Activity 18: Using diagrams and tables to calculate probability
Complete the missing details in the following tree diagram:
Draw a table showing all of the possibilities when 2 coins are tossed.
What is the probability of getting 2 tails?
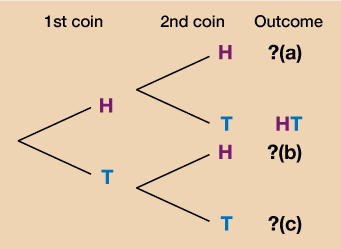
Answer
a.HH
b.TH
c.TT
Your table should look like the one below.
| HighlightedFirst coin | |||
|---|---|---|---|
| HighlightedH | HighlightedT | ||
| Highlighted Second coin | HighlightedH | HH | TH |
| HighlightedT | HT | TT | |
Out of the possibilities there is 1 in 4 or (1 quarter/25%) chance of getting 2 tails.
Remember that when you are checking your answers, you may have gone about the question in a different way. In a real exam it is always important to show your working as even if you don’t arrive at the correct answer you can still gain marks.
You’ve now completed Session 4 of your course, congratulations!
Summary
In this section you have learned:
- that the probability of an event is how likely or unlikely that event is to happen and that this can be expressed as a fraction, decimal or percentage.
- how to use a table or tree diagram to show the different outcomes of two or more events.