
Automobile manufacturers typically want to sell as many vehicles as they can make. This means that they need to appeal to the widest possible market. Let's examine the way manufacturers might use statistics and probabilities to influence some aspects of vehicle design and to ensure they meet market requirements.
There are many considerations which feed into automotive design but one of the key drivers (sic) has to be the customer’s physique.
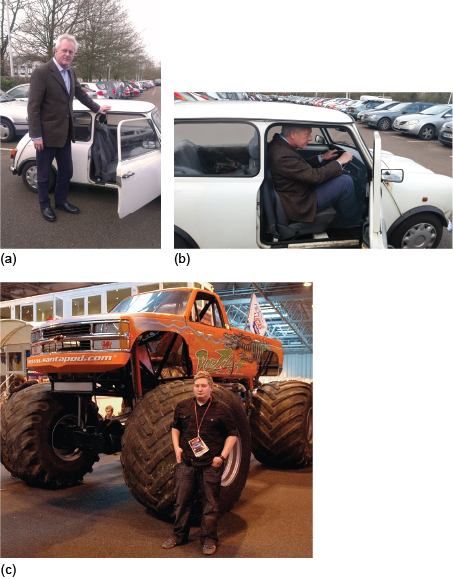
Figure 1: Both a, b) small and c) large vehicles present access and drivability problems.
Obviously, the driver has to be able to access and fit into the vehicle Figure 1. This can be a problem for very large or very small people. In fact, even people who are only a little taller than average may struggle in the case of some sports cars (see Figure 2) where vehicle height might be restricted by styling or performance requirements.

At the other end of the scale, access is a major consideration in the larger 4x4 vehicles where stepping up into the cab can be an issue for some people due to height, disability or infirmity. In fact many 4x4 vehicles are designed to lower themselves to facilitate access. Once inside, the driver must be able to reach and operate the controls: steering wheel, pedals and switches. Also, the vehicle safety systems must be appropriate to the occupants, this influences things like seatbelt locations and airbag deployment which could themselves cause injury if there is a poor match between design and occupants’ build.
It’s clear that people’s physique will be a key influence in selecting a car. So manufacturers need to understand how factors such as: height, leg length, arm length, weight and even physical strength influence sales and this requires understanding how such metrics are distributed. If I’m designing a vehicle’s interior I should like to know how much of the market I’m likely to exclude when I take decisions which might exclude large or small drivers. I could choose to build the interior around some sort of mean value but how much adjustment do I need to incorporate to accommodate, say, 95% of the market? To understand this I need to engage with the branches of applied science called anthropometrics (or anthropometry), which is the study of the measurement of size and proportions of the human body. Measuring people is far from simple.
Measure the length of your forearm. This is the distance between your elbow and your wrist.
This is far from simple. You’d maybe like to measure the length between the axis around which your elbow hinges then a similar axis for your wrist, or simply from the back of your elbow with a bent arm to a bone in your wrist. But, either way, these are not well defined and the proportion of error is quite significant. All we are doing here is identifying the need for consistency in what we do.
Here is a link to Adultdata, the handbook of adult anthropometric and strength measurement.
On pages 21 to 28 you will see the many different dimensions which are used to characterise human beings. If you look at page 30 titled ‘Stature’, you will see a table identifying:
- the country from which the data was obtained
- the sex of the participants from whom the data were obtained
- four columns of figures describing the mean, standard deviation and the 5th and 95th percentiles
- the source of the survey – this turns out to be vital since some of the data is taken from quite narrow sections of the population.
The main part of the handbook, which is section 7, uses this format to list data for all the dimensions shown in section 6.
If you look at section 5 you will see the data do not necessarily describe the same populations. For example, the age ranges vary and in some cases were never recorded. Clearly a person’s racial origin is an issue when evaluating anthropometric data; you can see this by comparing say Dutch statures to Sri Lankan. Gender is another obvious factor, but there are many other less apparent factors. For example, in many countries the population is getting taller over time. This means that much of the data in this handbook is likely to be out of date. Also this only covers adults, things get a lot more complicated when dealing with children where the rates of growth and growth proportions vary widely.
Use the Adultdata handbook to find a definition of how to carry out the forearm measurement you attempted in earlier.
This is given on page 123 as ‘back of elbow to wrist crease’. Although it’s not perfect it does provide a means to be consistent.
Now think of yourself sitting in the driver’s seat of a car and identify three factors which might influence your ability to drive the vehicle.
The three I got were:
- distance to pedals
- weight of steering (force required to turn the wheel) at low speed
- mechanical handbrake lever location.
Your three will probably be different because there are so many possibilities but this exercise is purely to help you think about the possibilities. 1. relates to height 2. to strength and 3. possibly to a combination of the two.
Given the three points I have suggested, how might a designer alter the vehicle in order to accommodate a wider range of physiques?
The solutions might be:
- Distance to pedals. This one seems quite straightforward. I simply have to ensure the driver’s seat will adjust over an appropriate range, but what does that do to the driver’s position in relation to the steering wheel?
- Weight of steering at low speed. Again seat position can be a factor but this is usually overcome by either altering the gearing or adding some form of power assistance.
- Handbrake lever location. This one might not have been a problem, except that I solved the first problem by making the driver’s seat adjustable. There are all sorts of solutions possible here. Fix the seat so that it doesn’t move, put a long lever on the handbrake. Some compromise, or maybe rethink the handbrake design and location entirely.
Here is a recording of an interview with Dr Paul Herriotts. Dr Herriotts is an ergonomist who designs vehicle interiors for Jaguar Land Rover. His job is to ensure that the vehicle is designed around the user. He is being interviewed by me, Dr Tony Nixon, senior lecturer in information systems and author of this article. I hope this will give you one perspective on how statistics play a role in industry.
Vehicle design requires an understanding, not only of how to measure physique, but also how to handle data which is distributed – one size will not fit all. The content of the Adultdata handbook provides information which is useful but needs some interpretation. In particular, most of the measurements are expressed in terms of things called ‘percentiles’ and their use is based on some knowledge of statistics.
The sort of question we would like to be able to address is:
‘What range of physiques must we accommodate in order to be sure that 95% of the population can drive the vehicle comfortably?’
In doing this you will see that we can also address other questions which are of interest to engineers, such as:
‘Given a batch of components, some of which are faulty, how many do I need to sample to ensure the number of faulty components is below a given threshold?’
For example, if I am manufacturing rivets and I can tolerate 0.3% being over size, how many from a batch of 1000 do I need to measure to be 95% sure that I know when I fail to meet this condition? This sort of question arises frequently in manufacturing and the mathematics required to answer it is the same as that required by the car designer.
Finally, an interview with Dr Herriotts, and his colleague Louise Malcolm, who is an ergonomist. This will hopefully give you a little insight into how anthropometrics are interpreted in automotive design.
This article is an extract from T276- Engineering: Professions, Practice and Skills.
Explore more...
-
Introducing engineering
Learn more to access more details of Introducing engineeringEngineering encompasses a broad range of disciplines from design to manufacturing. This free course, Introducing engineering, introduces a number of key themes that explore how engineering is undertaken in our modern world. These themes include engineering design, rules that govern engineers, manufacturing for products and electricity ...

Level: 1 Introductory
-
Study Engineering at The OU
Learn more to access more details of Study Engineering at The OUExplore your options for studying Engineering at The OU
Rate and Review
Rate this article
Review this article
Log into OpenLearn to leave reviews and join in the conversation.
Article reviews