Study skills
Studying can be daunting. These free courses will refresh your study skills and prepare you for success.
 video icon
Education & Development
My unique path to university: more real stories
Hear from Simon and Hannah, Wrexham students who share their stories of studying later in life and being the first in their family to go to University.
 video icon
Education & Development
My unique path to university: real stories
Hear from USW students who are sharing their varied experiences, including young carers, those with autism, and those who have joined university later in life.
 video icon
Education & Development
What is it like returning to education while working?
Ffion shares how her work as a support carer inspired her to return to university to study Learning Disability Nursing at Bangor University.
 activity icon
Education & Development
Applying to university - your step-by-step guide
The university application process may feel complex and overwhelming - follow this guide to get started and stay on track.
 activity icon
Education & Development
Are you making the most of your student budget?
The cost-of-living crisis has made everything more expensive. Now it is more important than ever to manage your money effectively whilst at university.
 free course icon
level 1: introductory icon
Education & Development
Am I ready to be an apprentice distance learner?
Distance learning can open up opportunities for study. You might have not studied for a while, you might be returning to education, or you might not have had the chance to study at a higher level before. This free course, Am I ready to be an apprentice distance learner?, will help to boost your confidence. You'll explore useful skills so you can...
 audio icon
Education & Development
Let’s Talk About Uni – a podcast about real student experiences
Are you wondering if university is right for you? Listen to students from all of Wales’ universities as they share their experiences.
 article icon
Education & Development
Good Academic Practice Collection
Explore our range of free resources on developing good academic practice and discover how to build them into your studies.
 video icon
Languages
Write it right: seven common writing mistakes
Tutors told us about common writing mistakes which can impact the grades students receive for their Open University assignments.
 activity icon
Education & Development
University lingo
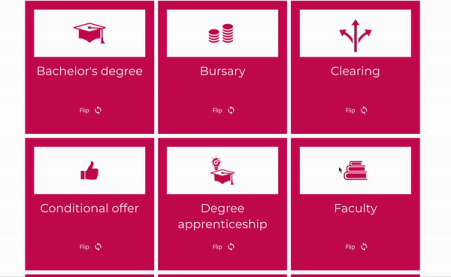
Do you know the difference between a firm choice and an unconditional offer? Or what a seminar or semesters are? Explore this interactive to demystify university terminology.
 article icon
Education & Development
Supporting your studies with assistive technology
How to adapt your device settings to suit your needs and find digital tools to support you with your studies.
 activity icon
Education & Development
Writing critically and structuring your essay - Academic Study Skills
Techniques you can use to help your essays flow coherently and to make your arguments clearer and more persuasive.
Find the right course for you
At The Open University, we're pioneers of flexible learning that's respected by employers and affordable for you. That's why more than 170,000 students are studying with us right now.
Whatever subject you want to study, and whatever qualification you want, we've got the right course for you.


Create your free OpenLearn profile
Track and share your learning and achievements.