
Building number confidence: Graphical data
4. Charts and graphs
4.5. Pictogram
A pictogram uses images, or symbols, to represent data in a simplified, visual format.
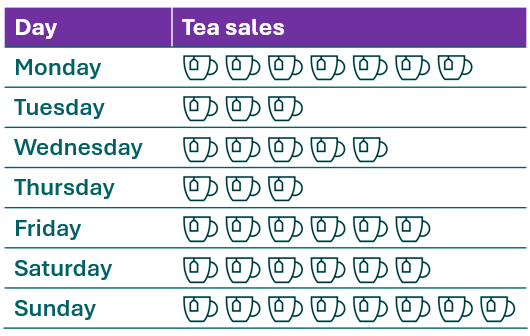
Each tea-cup represents 5 teas sold.
Data from: Daily sales table.
| Americano | Latte | Flat white | Cappuccino | Tea | |
|---|---|---|---|---|---|
| Monday | 76 | 14 | 20 | 12 | 35 |
| Tuesday | 60 | 30 | 14 | 25 | 17 |
| Wednesday | 57 | 28 | 30 | 22 | 25 |
| Thursday | 37 | 32 | 12 | 27 | 14 |
| Friday | 70 | 36 | 18 | 32 | 28 |
| Saturday | 72 | 35 | 27 | 16 | 32 |
| Sunday | 55 | 25 | 23 | 27 | 40 |
This pictogram shows tea sales for each day of the week, rounded to the nearest 5. There are 7 cup symbols alongside Monday, which indicates that 7 x 5 = 35 teas (to the nearest 5) were sold that day.
A pictogram is a simple format, useful for visual impact, but not suitable for sharing detailed information.
Data check
Looking at the pictogram, both Friday and Saturday have 6 cups. What were the approximate sales of teas on these days?
6 x 5 = 30, so approximately 30 teas were sold on both of these days.
A check of the data table shows that actual figures were (Friday) 28 and (Saturday) 32, however these have been rounded in order to represent an approximate sales picture using simple icons.