My OpenLearn Create Profile
- Personalise your OpenLearn profile
- Save Your favourite content
- Get recognition for your learning
Already Registered?

WASH: Context and Environment
If you create an account, you can set up a personal learning profile on the site.
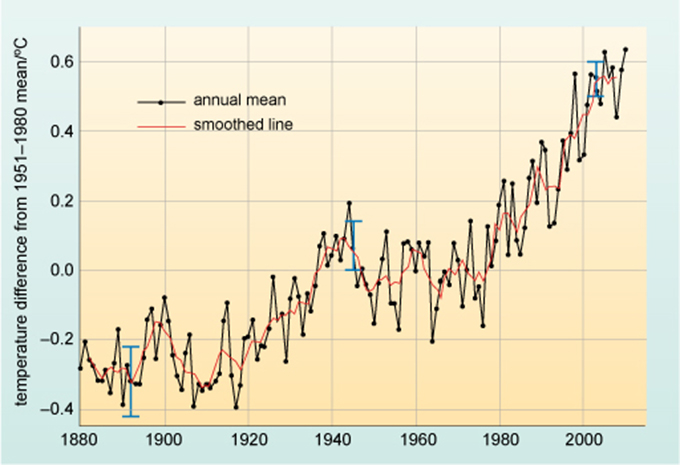
Figure 9.1 The global annual mean atmospheric surface temperature change from 1880 to 2010. 0 oC on the vertical axis is the mean global atmospheric surface temperature minus the mean global temperature from 1951 to 1980. The black line is the annual mean and the solid red line is a smoothed line through the annual mean. The blue bars show uncertainty estimates.
For further information, take a look at our frequently asked questions which may give you the support you need.
If you have any concerns about anything on this site please get in contact with us here.