3.2 The situation in Ethiopia
Figure 3.2 shows estimated trends in drinking water coverage in Ethiopia. Each of the columns shows the percentage of drinking water that is supplied by surface water, other unimproved sources, piped supply and other improved sources, for the years 1990 to 2012.
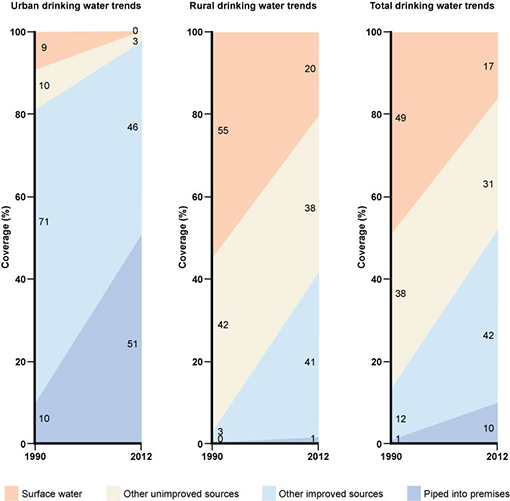
Look at Figure 3.2 and calculate the percentages of water supplied from improved water sources to urban populations and to rural populations in Ethiopia in 2012.
For urban populations, piped supplies to premises account for 51% and other improved supplies 46%, so the total is 97%. For rural populations, piped supplies to premises are only 1%, and other improved supplies are 41%, making a total of 42%.
One reason for the low coverage of rural premises is that the rural population is dispersed, and therefore difficult to serve easily. In urban areas, people live closer together and populations are more concentrated in given areas; therefore pipes can be laid more easily (and with less expense) to cover a large population.
3.1 Types of water source