
6.3 Maintenance strategy
Utilities with a strong focus on the preventive maintenance of assets can save substantial time and costs, avoid service interruptions, and increase their revenue.
A good maintenance strategy will detail:
- how the maintenance activities will be organised (on a regional and area basis)
- how maintenance will be carried out (using own technicians, or outsourcing to skilled technicians outside the utility, or both)
- clear descriptions of how the assets are expected to function with proper maintenance
- information and documentation requirements, for example a log of parts replaced, inspections made, recording of any incidents (unexpected events)
- prioritisation of assets for routine inspection and maintenance (the more important items, such as main pumps, needing more frequent inspection and maintenance).
At times key decisions have to be made to replace old or damaged equipment. Adept utility managers plan and decide in advance which assets require replacement and when. These decisions may be made based on past experience or on the opinions of individuals, although this may be unwise because experience and opinions vary from one individual to another. One technique that can assist in making objective decisions uses the concept of life-cycle cost. (An objective decision is one based on facts, unlike a subjective decision, which is one based on personal feelings or opinions.) The life-cycle cost of an asset is the sum of its one-time, non-recurring costs (for example, its purchase and installation costs) and its recurring costs (such as its operating cost, maintenance cost and disposal cost) over the life of the asset.
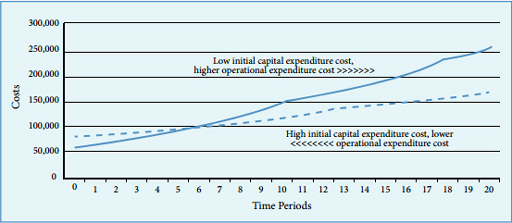
Look at Figure 6.5, which shows two life-cycle cost trends. The solid line shows the trend for an asset with a low purchase cost but high operating cost over time, whereas the broken line shows the trend for an asset which has a high purchase cost but low operating cost over time. Note that both graphs show cumulative costs (the total costs accumulated over the time period shown). The graph demonstrates that a high initial cost does not mean an asset has the highest life-cycle cost. Similarly, a low initial cost does not mean lowest life-cycle cost. Utility managers and technicians can use graphs such as these to help take decisions when replacing assets or acquiring new ones.
6.2.2 Maintenance