Module 5: Practical Business Spreadsheet Exercise
This practical exercise allows learners to apply the spreadsheet, formatting, formula, and data review skills covered throughout the course within a realistic business scenario.
This practical exercise allows learners to apply the spreadsheet, formatting, formula, and data review skills developed throughout the course within a realistic business scenario. The exercise is designed to reinforce practical Excel techniques commonly used in business and finance environments.
Practical Business Spreadsheet Exercise
Introduction
In this practical exercise, you will apply the skills developed throughout this course to create and review a simple business spreadsheet using Microsoft Excel.
The exercise combines spreadsheet structure, formatting, formulas, and basic analysis within a realistic business scenario.
Scenario
A small stationery business wants to track product sales and calculate total revenue for the week. The business currently records information manually, which increases the risk of errors and makes it difficult to review performance efficiently.
You have been asked to create a simple spreadsheet to organise product information, calculate totals automatically, and help the business review weekly sales performance.
Step 1: Create a new workbook
Open Microsoft Excel and create a blank workbook.
Rename the worksheet:
Weekly Sales Tracker
This will help organise the workbook clearly and make the spreadsheet easier to identify.
Step 2: Create the spreadsheet structure
Create the following column headings:
Product
Unit Price (£)
Quantity Sold
Total Revenue (£)
These headings will help structure the spreadsheet clearly and allow calculations to be performed more efficiently.
Step 3: Enter example data
Enter the following information into the spreadsheet:
Product | Unit Price (£) | Quantity Sold
Notebook | 2.50 | 15
Pen Pack | 4.00 | 8
Folder | 3.20 | 12
Desk Planner | 6.50 | 5
Highlighter Set | 5.00 | 7
Accurate data entry is important because formulas and calculations rely on correct information being entered into the spreadsheet.
Step 4: Format the spreadsheet
Apply the following formatting:
- Bold column headings
- Adjust column widths
- Apply currency formatting to prices and totals
- Add borders to the table
- Align the data clearly within the worksheet
Why formatting matters:
Businesses use formatting to improve readability, professionalism, and accuracy when reviewing information. Well-formatted spreadsheets are easier to understand and reduce the likelihood of errors when data is shared between colleagues or departments.
Step 5: Create formulas
In the Total Revenue column, calculate total sales revenue for each product.
Formula example:
=B2*C2
This formula multiplies the unit price by the quantity sold.
Copy the formula down for the remaining rows to calculate total revenue for each product automatically.
Excel formulas improve efficiency because calculations update automatically if the data changes.
Worked Example:
If a product costs £5 and 10 units are sold:
=5*10
Result:
£50
This demonstrates how Excel can quickly calculate business information while reducing manual calculation errors.
Step 6: Calculate total weekly revenue
At the bottom of the spreadsheet, use the SUM function to calculate overall revenue.
Example:
=SUM(D2:D6)
The SUM function automatically adds all values within the selected range.
This allows businesses to calculate totals quickly and accurately without needing to manually add figures together.
Step 7: Review the data
Once the calculations are complete, review the spreadsheet and answer the following questions:
- Which product generated the highest revenue?
- Which product sold the lowest quantity?
- Which products performed best overall?
- What could the business do to increase sales performance?
This stage introduces simple business analysis using spreadsheet outputs.
Discussion
Excel is widely used because it allows businesses to calculate information quickly, organise data efficiently, and reduce manual errors. Even simple spreadsheets can help organisations track costs, review sales performance, monitor operational activity, and support basic decision-making.
Many businesses rely on spreadsheets daily because they provide flexibility, visibility, and quick access to important information.
Reflection Activity
Consider another business scenario where Excel could be useful. Examples may include:
- budgeting
- employee scheduling
- expense tracking
- stock management
- sales forecasting
Write a short paragraph explaining how spreadsheets could support that activity and improve efficiency within the business.
Further Practice
To continue developing your Excel skills, try extending the spreadsheet by:
- adding additional products
- calculating average sales values
- creating monthly totals
- applying conditional formatting
- creating a simple sales chart
These additional activities will help strengthen your confidence using Excel in practical business situations.
Example spreadsheet output created during the practical business exercise: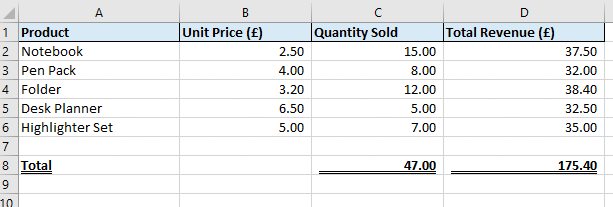
Course Summary
In this course, you explored how Excel supports everyday business and finance tasks. You learned how to organise information, apply formulas, review data, and create simple spreadsheets for practical business use.
You also applied these skills within a realistic business scenario using calculations, formatting, and basic analysis techniques.
These introductory skills provide a strong foundation for further Excel learning and more advanced spreadsheet analysis in professional environments.