

2 Setting priorities
Activity 3
Consider whether the relative economic aspects should determine the degree of priority given to different aspects of the risk scenarios in Figure 1.
It should be clear from Figures 1 and 2 that the range of incidents a manager could examine, and similarly the range that we could consider in this unit, extends from disasters to relatively minor inconveniences. While the local event is of concern to most individuals, major incidents receive greatest publicity and raise more general concerns about the risks of technology. In fact, the perceptions of risk are not based solely on quantitative measures but include subjective value judgements. These may be influenced by the degree to which the risk is imposed upon us rather than accepted voluntarily, our knowledge of the problem, our trust in the ‘management’ of the risk and so on, but more of that later. The net result is that reaching a consensus view can be difficult. Later in this unit we will explore some specific incidents in greater detail. For the present, however, we can accept that such major industrial incidents have important consequences in terms of death, ill health, and environmental and economic impact.
Returning to our question about setting priorities, the economic factor may not be a reliable one for setting priorities because it is difficult to place economic value on the cost of human life and illness and on the costs of environmental harm. Certainly the area of environmental economics is a developing one but it will not be considered further here.
The first detailed study of the cost of accidents was made in 1931 by Heinrich (see Heinrich, 1990). By examining many thousands of insurance records and interviewing many staff he derived a statistical relationship that the uninsured costs (he called these the indirect costs) were typically four times higher than the direct costs covered by insurance. This relationship is commonly represented as an iceberg (Figure 3).
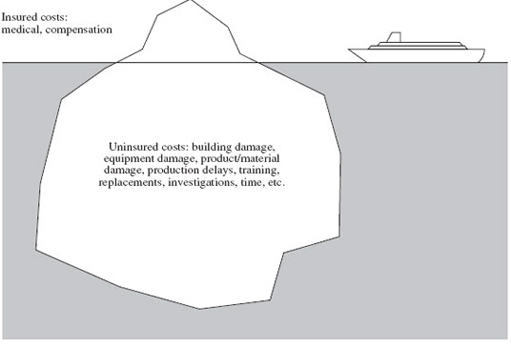
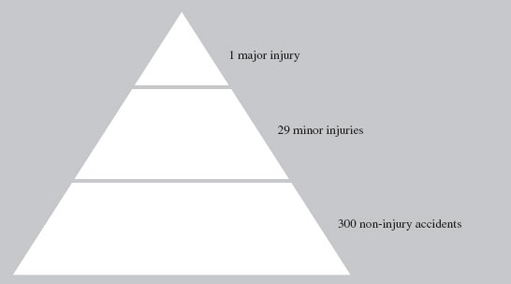
In the UK, companies are required by law to have employers’ liability insurance cover, but cover for the other aspects of potential loss depends on many factors, including the availability and cost of cover as well as the organisation's perception of the risks of such loss. Heinrich also developed the concept of a non-injury accident. He defined this as an unintended event that causes property loss by damage to plant, equipment or materials, but does not cause actual injury, although it may have the potential to do so. Such events are many times more common than those involving injury, as his accident triangle illustrates (Figure 4).
Activity 4
If you were setting out to repeat Heinrich's study, how might you develop this approach?
In particular, what main features would you consider in addition to those indicated in our summary of his work?
In fact many studies have followed Heinrich's approach, but they have often focused on the ratios of incidents within specific organisations. Annual reports by the Health and Safety Executive (HSE) in the UK show significant differences between industry sectors as summarised in Table 1.
In these studies by the HSE Accident Prevention Advisory Unit (APAU), non-injury accidents are defined in wider terms than in earlier studies, and include all unintended events causing loss, even when there was no potential for causing personal injury. As Table 1 shows there are marked differences between types of organisation. This study also found that the ratio of uninsured costs to insured costs was substantially greater than Heinrich's 4:1 ratio, and ranged from 8:1 to 36:1. Clearly, the mix of industrial activities, the management and training within the organisations and the definitions of accident categories have contributed to different results between the studies since Heinrich's time. Your answer to Activity 4 should have identified some of these features.
| Reportable personal injury | Other injury | Non-injury | Accidents per year | |
|---|---|---|---|---|
| Food manufacture | 1 | 5 | 148 | 11 |
| Road haulage | 0 | 1 | 296 | 14 |
| Construction | 1 | 56 | 3569 | 87 |
| Oil production | 1 | 4 | 126 | 5 |
| Hospital | 1 | 10 | 195 | 7 |