

3 How can teachers assess students’ conceptual understanding?
Effective assessment will elicit students’ underlying conceptual understanding rather than just what information they can recall. Students may do reasonably well in tests that rely on recall and have only a superficial conceptual understanding. Although understanding can be assessed through skilfully written questions, there are other techniques that you can use to elicit students’ conceptual understanding and their understanding of the links between different concepts. Such techniques include drawings, predict–observe–explain, sorting activities, relational diagrams and concept mapping.
Activity 5 Assessing understanding
Part 1: Drawings
Drawings allow students to express ideas that are hard to express in words. For example, students can be asked to draw what’s inside the body, how we see objects or how plants get their food (Figure 1).
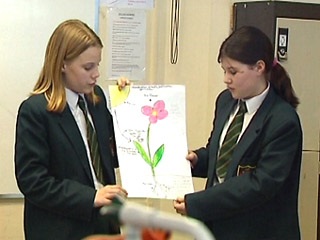
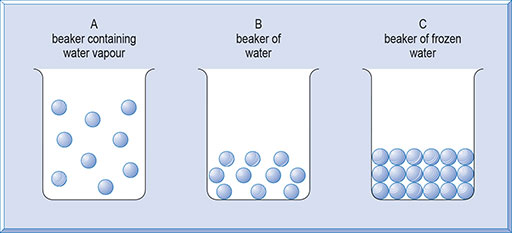
Figure 2 shows three beakers containing water in a different state: as a vapour, a liquid and a solid. The drawing illustrates a student’s view of the way the particles are distributed in these three different states.
Note down your responses to the following questions:
- To what extent does Figure 2 match the scientific understanding of the behaviour of particles in solids, liquids and gases?
- What possible misconceptions are revealed?
Now redraw the particles in the containers so that they are more scientifically accurate representations of the water particles. Explain the differences between the two diagrams and the significance of the differences.
Part 2: Predict–observe–explain
Predict–observe–explain (POE) focuses students on an observable event and elicits their theories.
Consider these two situations:
- Situation A: A block of wood rests on a table. Predict what would happen if you pushed the block along the table.
- Situation B: Two objects (e.g. a ball) are the same shape and volume, but of different weights. Both objects are dropped from 30 metres above the ground. Predict which object will reach the ground first. Produce a clear explanation of your reasoning.
Having observed what happens, a student gives the following responses:
- Situation A: ‘The block will move and then slow down, because the force is only there at the start.’
- Situation B: ‘The heaviest ball will reach the ground first because it falls faster.’
These are typical responses based on common misconceptions about forces. What ideas are these responses based on?
For each situation, answer the following questions:
- What was being assessed?
- What did the students’ responses reveal about their understanding?
- What would happen in reality?
- What is the accepted scientific explanation?
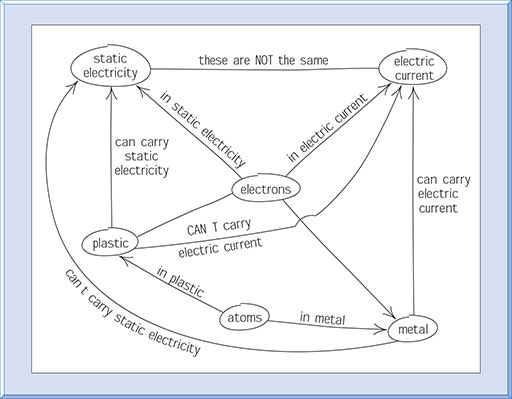
Part 3: Concept mapping
Concept maps are not the same as brainstorms, spider diagrams or flow charts. They are more sophisticated because they reveal the conceptual understanding of the person devising the map. Pairs of concepts are connected by words and phrases along an arrow that shows the direction in which each pair should be read. So for example, how would you connect the concepts of ‘water’ and ‘ice’?
Consider the three concept maps in Figures 3–5 (White and Gunstone, 1992, p. 25), which show a variety of understandings of electricity.
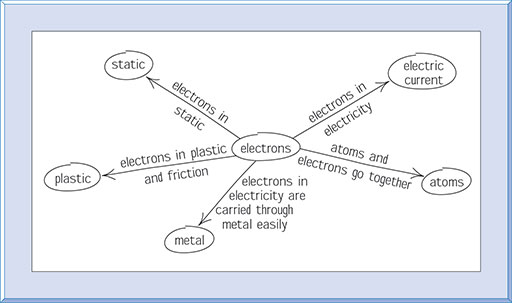
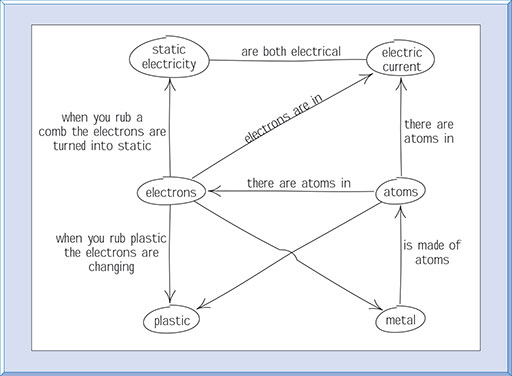
Next, answer the following questions:
- Which map do you think shows the best understanding and why?
- Which map shows the lowest level of understanding and why?
- What misconceptions are revealed by each map?
- What would you do to confirm your interpretations of the maps?
Follow the instructions given in Resource 2, ‘Concept mapping’ [Tip: hold Ctrl and click a link to open it in a new tab. (Hide tip)] , to construct a concept map of your choice. Then think about the process you have just been through.
- How does the process elicit understanding?
- Which terms caused you the most problems?
- How does the map reflect this?
The connecting words reveal how someone sees the relationships between concepts. Terms that are not used or are not well-connected (spurs) suggest a poor understanding.
Concept maps can be used to support teaching as well as to assess understanding. For example, completing a concept map as a group to consolidate new work enables students to discuss their ideas. By listening to the conversations, the teacher can assess students’ understanding.
Plan to try one or more of these techniques in your own teaching. You can find out more about concept mapping and teaching students how to construct concept maps in Resource 2.