2 Census data discussion
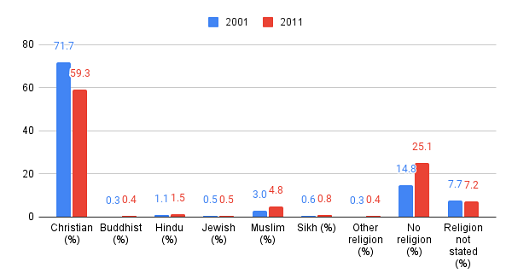
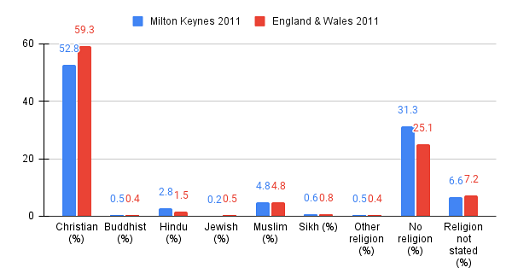
Figures 1 and 2 compare the reduction in the number of people across England and Wales identifying as Christian, with the same statistic specifically in Milton Keynes.
The census data shows that the number of people who identify as Christians dropped by 12.4% between 2001 and 2011, nationwide. Those identifying as not religious increased by 10.3%, while the Muslim population increased from 3% to 4.8%.
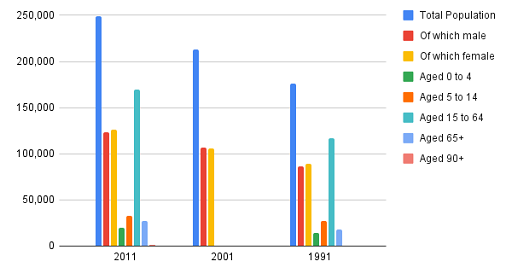
Milton Keynes is the largest town in Buckinghamshire and according to the 2011 census, the town has an average population of 230,000. Later statistics place the total number of Milton Keynes residents around 245,000.
Figure 2 shows that Milton Keynes largely follows national trends across England and Wales, with a slightly larger increase in those identifying as not religious.
Today, Milton Keynes has 6.5% fewer identifying as Christian than the national average, and 6.2% more non-religious. Yet the Jewish and Sikh communities are also smaller than the average.
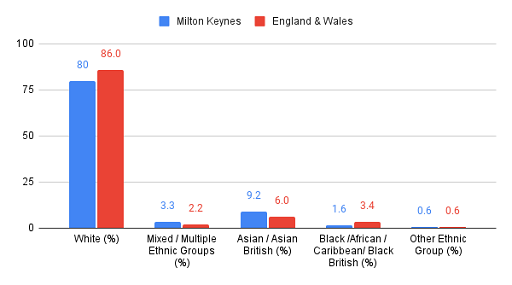
Milton Keynes in 2011 is less white than the national average. However, it is also less black. Asian and mixed ethnicity groups make up the difference, being higher than the national average.
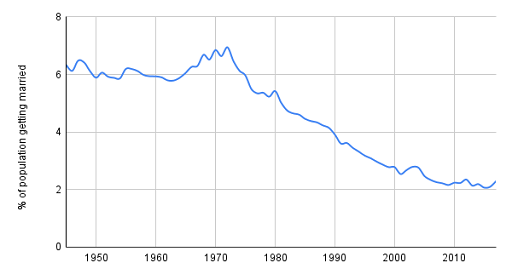
The percentage of the population marrying has dropped steadily since the early 1970s, but this has actually started to level out since the last census.
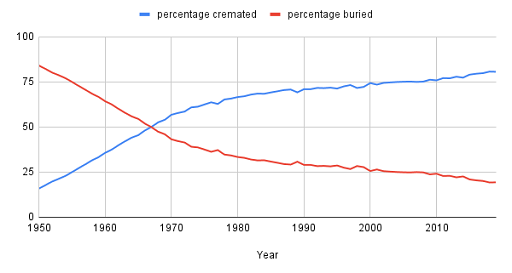
Around the same time, nationwide, cremations overtook burials as the preferred form of final disposition. Today, the proportion is almost the reverse of what it was in 1950.
The population of Milton Keynes has grown steadily. The high proportion of working age people suggests that a higher-than-typical proportion of the population are ‘economic migrants’ to the city.
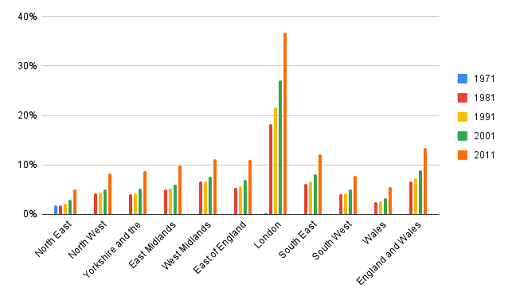
The South East of England has the second-highest proportion of the population born outside the UK, taking over from the West Midlands during the 1990s. However, it is still below the average for England and Wales.