

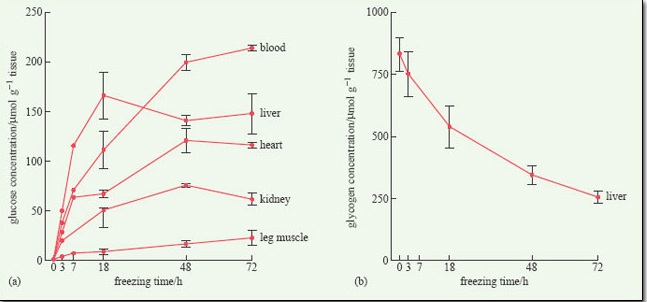
Figure 14 (a) Changes in the concentration of glucose in various organs of the wood frog (Rana sylvatica) over 72 hours of freezing at −2.5°C in the laboratory. (b) The corresponding depletion of liver glycogen reserves. Note that the horizontal axes are non-linear. Data from Pinder et al. (1992).