2.1 Frequency of different types of weather
One definition of climate might be:
‘the frequency of different types of weather over a given period and in a particular place’.
This conveys the idea that climate describes all possible kinds of weather, not just the average, and – importantly – it takes account of how often each kind occurs.
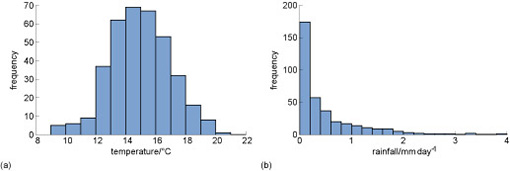
In a single location, over time, the weather might range from freezing cold to swelteringly hot, and from drought to heavy rain. You could record all these aspects of weather over one year – say, daily temperature and rainfall – by drawing a histogram (or a ‘frequency chart’) for each (Figure 1).
In each histogram, the height of each rectangle gives the number of data in that range. The total area of the histogram is equal to the number of data samples (here 365 days).
How many times in the year of data is the temperature in the range 12–13°C?
The number of counts (frequency) of this temperature range is approximately 35.
How many times is the rainfall in the range 0.2–0.4 mm day-1?
The number of counts (frequency) of this rainfall range is approximately 60.
Taking account of the whole range of weather types gives you a more complete picture of climate. It allows you to take extremes into account in a way that you wouldn’t be able to if you looked only at ‘average weather’.
Using all the available weather data is important because at the heart of the study of climate is the subject of statistics: the analysis and interpretation of data. Climate science is often about searching for subtle shifts in the data.

