

2.1 Representative Concentration Pathways
The IPCC currently uses four ‘possible futures’ called Representative Concentration Pathways (RCPs). These were defined for the IPCC Fifth Assessment Report in 2013–4 (van Vuuren et al., 2011). The process of defining an RCP begins with imagining a plausible description of the future: a socio-economic scenario of possible population, global domestic product (GDP), energy usage and sources, and so on. This scenario is then translated into a set of:
- a.greenhouse gas concentrations
- b.air pollutant concentrations (such as industrial sulfates)
- c.changes in land use (e.g. conversion of forest to cropland).
These are then used by climate models to predict future climate change for each RCP.
The RCPs are called ‘representative’ concentration pathways because they represent the range of futures that have been suggested as possible by previous studies. The four scenarios have the rather technical names RCP2.6, RCP4.5, RCP6.0 and RCP8.5.
Figure 1 shows the predicted changes in population and primary energy consumption for the scenarios underlying the four RCPs. Primary energy is the energy embodied in natural resources such as coal, natural gas, crude oil, solar energy, wind energy and biomass before they are transformed for use.
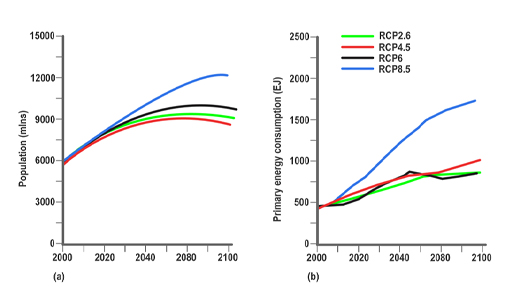
-
Looking at Figures 1a and 1b, which RCP would you guess has the highest greenhouse gas emissions and therefore the greatest warming effect on climate?
-
RCP8.5 has both the highest population and the highest primary energy consumption. This scenario therefore seems most likely to have the highest greenhouse gas emissions.
Actually, this is indeed the case. The four RCPs described in more detail are:
- RCP8.5: an energy-intensive scenario of very high greenhouse gas concentrations, in which emissions continue to increase through the 21st century
- RCP6.0 and RCP4.5: two stabilisation scenarios, in which emissions stop increasing by the end of the 21st century
- RCP2.6: a mitigation scenario, in which emissions peak in the middle of the twenty-first century and then decline.
The different greenhouse gas concentrations in the RCPs are produced different human emissions of the gases. Figure 2a and 2b show an example for one of the greenhouse gases: it shows the changing CO2 emissions into the atmosphere and corresponding CO2 concentration in the atmosphere.
Remember: there is a difference between emissions and concentrations. Think of the atmosphere as like a bath, and carbon dioxide as like the water. The rate of emissions of CO2 into the atmosphere is like the rate of water flowing in, while the concentration of CO2 in the atmosphere is like the amount of water in the bath. Burning fossil fuels releases CO2 into the atmosphere (emissions), which increases the amount in the atmosphere (concentrations).
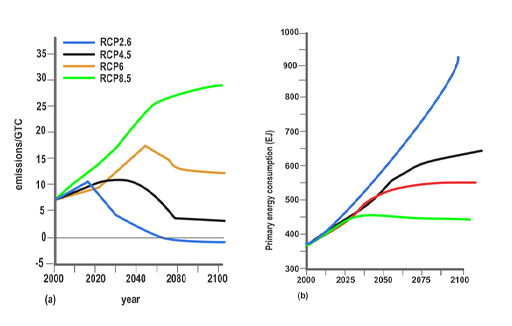
All four RCPs show increases in greenhouse gas concentrations in the future (Figure 2b). This gives a net positive forcing: in other words, all of them lead to a warming of the climate. Of the four, RCP2.6 has the smallest total forcing (the least warming effect on climate), followed by RCP4.5, RCP6.0 and RCP8.5, which has the highest.
-
What happens to CO2 emissions in RCP2.6 towards the end of the century?
-
Figure 2a shows that in this RCP the CO2 emissions become slightly negative – that is, humans will need to extract more CO2 from the atmosphere than we emit – by the last two decades of this century.
The RCPs are the standard scenarios of predicting possible future climate change. You will see how scientists predict climate change for different possible geoengineering actions later in the course. One important question you will consider is: how could we use geoengineering to achieve negative emissions of CO2?
Scientists try to predict climate change for each RCP using climate models. The climate models take the concentrations of greenhouse gases and pollutants, and the land use changes, and simulate the Earth system response: predicting changes in temperatures, rainfall, sea ice, and so on.