Skip to content
Skip to main content

About this free course

Download this course

Share this free course

MSE’s Academy of Money

Start this free course now. Just create an account and sign in. Enrol and complete the course for a free statement of participation or digital badge if available.

The image is a block histogram showing the number of repossessions of owner-occupied and buy-to-let properties between 2008 and the end of 2017. The histogram shows a rise in repossessions from 2008 to 2009 followed by a substantial decline until 2015. Subsequently repossessions level off at a very low level of around 2000 properties per quarter year. Until 2015 the majority of the repossessions were of owner-occupied properties. After 2015 repossessions of owner-occupied and buy-to-let properties were approximately equal in number.
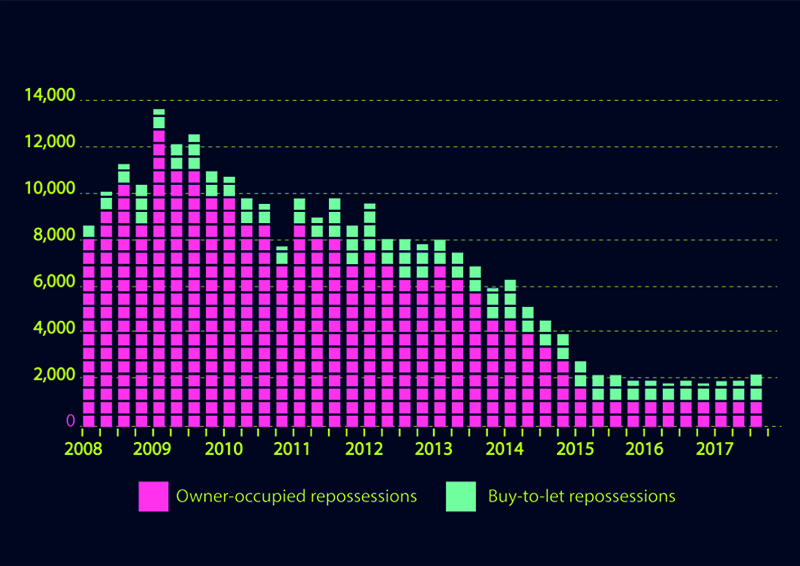
Figure _unit5.7.1 Figure 8 Repossessions, buy-to-let and owner-occupied markets. Source: CML (2017).

 6 Mortgages: understanding and managing the risks