Skip to content
Skip to main content

About this free course

Download this course

Share this free course

MSE’s Academy of Money

Start this free course now. Just create an account and sign in. Enrol and complete the course for a free statement of participation or digital badge if available.

The image is a line graph showing the movement in the FTSE-100 index from its launch in 1984 to early 2020. Over that time the index rose from 1000 to over 7000. Whilst the trend has been clearly upwards there have been some significant falls in the index during these years – most significantly in the early 2000s and again in the late 2000s. The fall in the early 2000s resulted from the bursting of the ‘dotcom’ bubble (the speculation in internet-related companies). The fall in the late 2000s resulted from the worldwide banking crisis. The sharp fall in early 2020 relates to the impact of the Covid-19 pandemic.
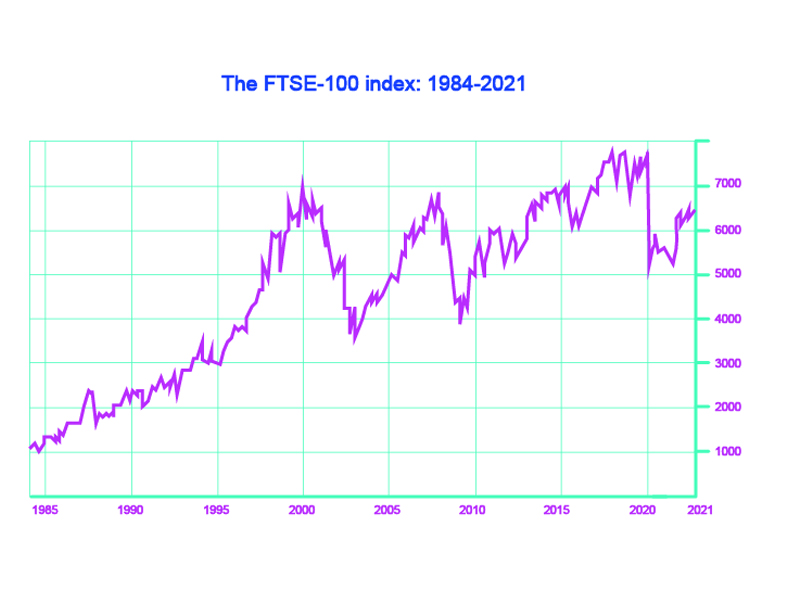
Figure _unit6.11.1 Figure 11 The FTSE-100 share index 1984-2020

 10 Investments – the riskier (but possibly rewarding) side of saving up