

2.4 Aperture photometry
This short video and the following activity explain how to carry out aperture photometry on your own images.
Download this video clip.Video player: aperturephotometry_v2.mp4
Transcript
ALAN:
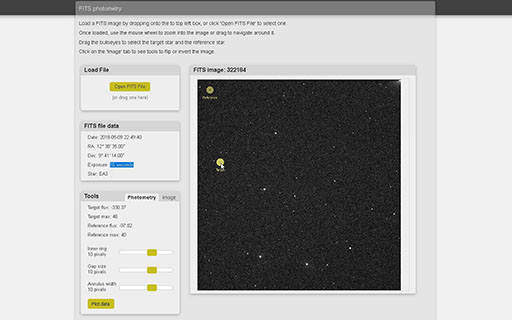
Here we are in the FITS photometry tool. I've got some instructions at the top. And the first thing that I need to do is to open one of the FITS images that I've downloaded from telescope.org.
So I can do that from the Load File window. I can drop an image on here. Or I'm going to click Open FITS file and select the file from a list. So here are my images of variable star EA3. I'm going to open this one, 322184.
And here I've got my image in the viewing window. I've got some information about the image, which I can check here. The date and time, make sure that's what I expected, the coordinates of the star. And importantly, the exposure of the image, 16 seconds for this image, which corresponds to what I expected.
And this is for variable star EA3, which we might recognise from the finder charts is this star here in the centre with this V-shaped formation of stars, easily recognisable. And the reference star over here. And I can use the scroll wheel to zoom in if I want to do that just to confirm. Here's my target star and here's my reference.
Now in order to measure the brightness, I'm going to move these little selection targets, one for the target, one for the reference star, onto the appropriate stars. And again, let me just zoom in here. We can see that for the target I've got the little rings. The software is going to measure the brightness of all the pixels in the central ring and subtract off the background in this outer annulus here, this outer ring.
So I can change the size of these rings. I can change the inner ring. I can change the size of the gap between the inner and outer rings. Or I can change the width of the annulus.
And for this image, I found that values of 10 for each work quite well. You may need to adjust those depending on how large the stars are in your image. So I'm going to move the target rings onto the target star, which is this one, the top of the line of three here, the right-hand one of those.
So I'm going to move the target onto there until the star is centred in the central ring. And the first thing I want to check is that the exposure of my image is OK, which I can do over here by looking at the maximum value 27,637. So that's absolutely fine. It's between 10 and 50,000. So that's OK.
And now I've positioned the target. I've got a readout of the brightness of my target star here, target flux. So all we need to do now is to position the other selection rings onto our reference star, which we'll remember is this one with a fainter star next to it, and this pattern of three stars above it.
And so, I'm just going to move the reference rings until that's centred on the reference star like that. And now I've got a value for the ref flux of the reference star as well. And the maximum value, again, is between that 10 and 50,000. So that's all correctly exposed. The exposure is absolutely fine.
So I'm now going to go ahead and record my observation by selecting Plot Data. And this will send the data to the star plotting software. So I just click on Plot Data, and that gives me an option there.
The data have been added to the light curve plot. I can go to view the plot straight away, or I can press OK and view the plot at a later date, which is what I'm going to do now. And that's the measurement made for this image.
Interactive feature not available in single page view (see it in standard view).
Activity 2 Aperture photometry
Timing: Allow approximately 40 minutes
Open the photometry tool and upload images
- To use the photometry tool, go to the Astronomy with an online telescope page in the OpenScience Laboratory [Tip: hold Ctrl and click a link to open it in a new tab. (Hide tip)] :
Follow the link FITS photometry. This takes you to the photometry tool. The page has some brief instructions on how to use the tool.
- Upload the FITS images of your variable star as shown in the video. Check that the information in the FITS file data window is correct (date and time and name of variable star).
Check exposure
- The first step is to check the exposure of your images. For the photometry to work correctly it is important that you take measurements from an image that is correctly exposed – neither overexposed nor underexposed. For your first set of images you should have bracketed exposures of 15, 30, 60 and 120 seconds and you should check each of these in turn.
- Set the aperture and ring sizes as shown in the video (Inner ring 10, Gap size 10, Annulus width 10). Adjust these as necessary depending on the size of the stars in your image.
- For each image place the aperture over the star that you have identified as your target star and note the maximum pixel value (labelled "Target max"). Repeat for the reference star. An image is correctly exposed if this maximum value is between 10 000 and 50 000 for both stars. If you have more than one image in which both stars are in this range, select the image with the longer exposure.
- When you have found which of your images has the correct exposure, make a note of the exposure time (this is shown in the FITS file data window). You can use this same value for the exposure when requesting further images of the same target.
Make the measurement
- You are now ready to do the aperture photometry itself. Open the image that you have selected as having the correct exposure.
- Place the aperture over the target star and note the Intensity value (labelled "Target flux"). This is a measure of the overall brightness of the star, made by adding up the brightness of all the pixels in the central aperture and subtracting the background from the annulus.
- Place the aperture over the reference star and note the Intensity (Target flux) value.
- You now have all of the information that you need to plot your observation on the light curve. Click Plot data to send your data to the variable star plotter. This will give you a choice to view the light curve straight away by clicking View plot, or you can simply click OK and view the light curve later from the Astronomy with an online telescope page in the OpenScience Laboratory.