6 Finding a percentage of a number
There may be times when you are given a number and you need to find out a percentage of that number. One possible situation would be finding out how many marks are needed in a test to achieve the required percentage pass mark.
For example, suppose a maths test is out of 75 marks, and students need to achieve at least 60 per cent to pass. How many points guarantee a passing grade?
To pass, the student has to earn at least 60 per cent of 75. Here, you can change the percentage into a fraction, then calculate the marks required. You can work this out by simplifying the fraction and then multiplying.
Here is one way of reaching the answer:
Or, you can convert the percentage to a decimal and multiply by this, as follows:
60% = 60 ÷ 100 = 0.6
So the number of marks required to pass the maths test = 0.6 × 75 = 45.
And it is no surprise that both methods gave the same answer!
This means that you can choose whichever method you prefer – either converting the percentage to a fraction or a decimal – and then multiplying by the number.
The method you choose can depend on what tools you have to hand. If you have a calculator, converting to a decimal can be the easiest option; if not, you may find it easier to convert to a fraction and cancel to give yourself easier numbers to work with. Have a go at this in the next activity.
Activity 2 Going solo
a.A radio programme reported the following:
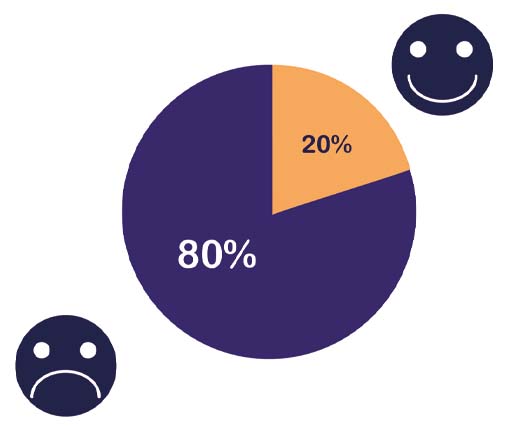
Our ‘Going Solo’ survey of 4000 single people found that only one in five people are happy on their own.
Write ‘one in five’ as a fraction, a decimal and a percentage. Which form do you think is easiest to understand? Show fractions on one line using the ‘/’ symbol, e.g. one half would be entered as ‘1/2’.
Hint: what does one in five mean? For every five people interviewed, one of these said they were happy on their own. Write this as fraction first.
Answer
- a.‘One in five’ can be written as or , as well as
The report could have said ‘one-fifth’ or ‘20 per cent’ of people in the survey, but ‘one in five’ makes the proportion easy to visualise for people not comfortable with fractions and percentages. Which form is easiest to understand depends on your way of thinking. You may have noticed already that you are feeling more confident with different ways of representing proportions. Remember, all of these express the same number, although ‘0.2 of the people’ would probably not be used, because it’s much harder to visualise and put in context.
- b.How many of the 4000 ‘Going Solo’ survey participants seem to be content with being single?
Hint: you know that it’s one-fifth of the group, and remember: ‘of’ means ‘multiply.’
Answer
- b.. So 800 out of the 4000 surveyed single people feel happy on their own.
You can show this visually using a pie chart, which divides a circle into the different proportions to represent them. If you continue on to Succeed with maths - Part 2, you will learn more about pie charts and other visual ways to represent data.
Now you know how to work out the percentage of a number, what about working in the other direction? Using the last example in Activity 2, if you know that 800 people out of a group of 4000 said that they were not happy living on their own, how do you turn these two numbers into a percentage to represent the proportion? The next section will look at this.

