

2.4 Wave motion
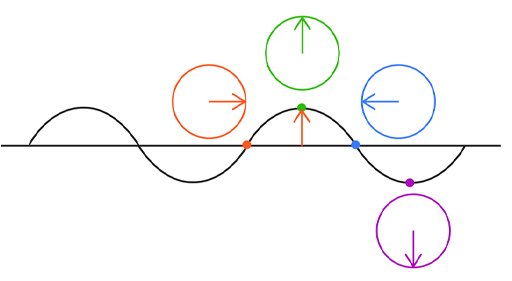
How can we capture both the heights of the wave crests and troughs as well as the undulation of the wave, without using complex mathematics? It can be done! Let’s say we have a wave of a certain amplitude. Now think of the wave as being represented by an arrow of a length that equals the amplitude and which rotates in a circle as the wave progresses, such that it points up at a crest and points down in a trough.
You may be wondering how this picture is useful. It helps us to understand what happens when two waves meet. If you throw two stones into a pond, you can see circular waves emanating from both impact sites. Eventually these waves will overlap. In fact, they’ll essentially pass through each other, with the heights of the two waves combining to form the resulting wave pattern.
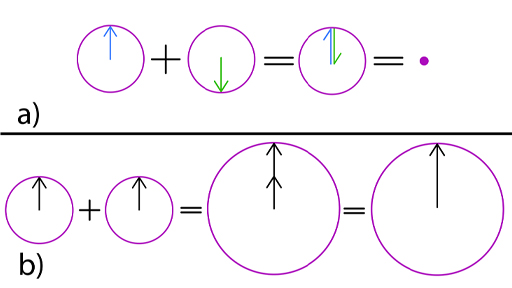
Let us consider a situation with two waves in terms of our arrow picture. For simplicity, let’s also assume that the amplitudes are the same, so there are two arrows of equal length. As the waves progress, our arrows rotate around. How do the waves add up? If at any place and time both arrows point up, the waves add together and produce a crest of double the height. If both point down, this produces a trough of double the depth. However, if both arrows point in opposite directions, the waves cancel out. The way the two waves interact is determined by the angle between the two arrows. This is often referred to as the ‘phase’ or ‘phase difference’.
So, in the right circumstances – with the correct phase difference – waves can cancel out. There are modern electronic devices that make use of this fact: noise-cancelling headphones. They are in fact making noise that cancels out the noise around you!
These kinds of interactions between waves are described with specific terms: the most common being ‘interference’ and ‘superposition’. The former is commonly used for sound waves or electromagnetic waves. Superposition is a term that is more commonly applied to quantum waves. This type of interaction is characteristic of waves.
Observing an interference pattern is seen as clear evidence of wave motion. A typical setup for observing such a pattern is the double-slit experiment.
The double-slit experiment is an experiment where light is projected onto a screen. An opaque barrier with two thin slits cut into it is then placed between the light source and the screen. When this experiment is performed correctly, an interference pattern of light and dark stripes appears on the screen.
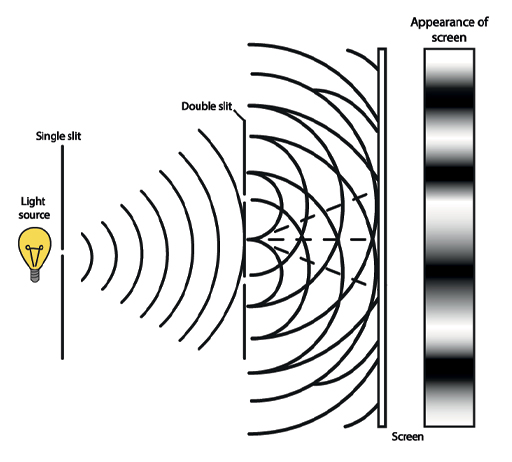
If we think in terms of light, the interference pattern consists of bright and dark stripes (or if we just consider a two-dimensional slice, bright and dark spots). The reason that these stripes form is due to the phase difference. This result comes from the difference in the path lengths of light that travelled through one slit compared with light that travelled through the other slit. Whenever the phase difference causes the waves to cancel, it produces a dark stripe. When they point in the same direction, it produces a bright stripe.
Note that the phase difference is all that matters here. The brightness of the light itself does not impact the direction of our arrow. Note that in order to observe this interference effect, the double-slit setup must have a size that is comparable with the wavelength of the light – so it has to be very small for visible light. Also, you will need a nice beam of light, which consists of a single wave rather than a mixture of many waves. Such light is provided by a laser as a light source.
Having covered these concepts, it’s time to ask how things work in the realm of quantum physics.