

3.1 View your results on the light curve
This short video and the following activity explain how to review the light curve with your results.
Download this video clip.Video player: variable_star_plotter_v3.mp4
Transcript
PROFESSOR:
OK, I'm now in the variable star plotting tool. And my results have been sent through. So the image that we've just analysed is this one here. Is the central one, EA3, image taken on this date. And the results that we had from the aperture photometry have been sent through to the plotting tool.
So I've got results from two other images already in the plotting tool. These were images that I'd taken on different dates. So I've now got three data points in the variable star plotter. So in order to look at those, what I need to do is to go down to the light curve box and make sure that I've selected the correct star. So the one that we're looking at, remember, was EA3. That's the one that we measured with the aperture photometry tool. So if I select EA3, I can see that my three measurements are highlighted in red here taken on these dates. And then there's a bunch of other measurements taken by other people in green here showing the light curve on different dates.
So at the moment, it's quite difficult to make out any sort of pattern. So what I can do is press Fold Data. And that combines all the results onto a single period of the object. And here we can see now I've got my light curve-- all of the green measurements made by other people combined with my red measurements, showing something interesting going on with the star here and then continuing on. So my measurements have been added to those made by other people. And just as Jo described, as people continue to add their results to the light curve, this will build up to form a complete picture of the behaviour of this variable star.
Interactive feature not available in single page view (see it in standard view).
After watching the video, submit your own results to be added to the light curve by following the steps in Activity 3.
Activity _unit9.4.1 Activity 3 Reviewing the light curve
Timing: Allow approximately 20 minutes
Open the light curve plotting tool
- Go to the Astronomy with an online telescope COAST webpage:
and select the link Variable star light curve. This takes you to the light curve plots for all of the variable stars being investigated at different times of the year by participants on this course.
Check your data
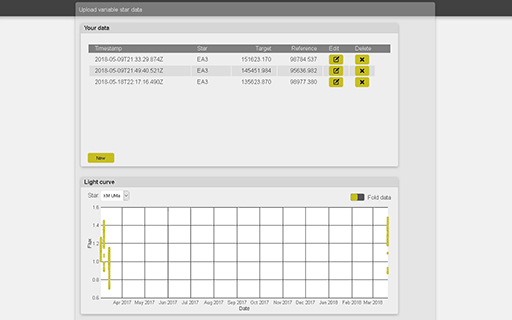
- In the upper half of the variable star plotter is a box labelled Your data. The results that you added in Activity 2 should be listed there. Check that the date and time and name of the variable star are correct.
- If necessary you can edit the values, change the name of the variable star or delete any data point using the Edit and Delete controls on the right hand side.
View the plot
- To view the light curve, select your star from the dropdown list in the Light Curve pane in the lower half of the display.
- Your data points will be shown in red, together with data points contributed by other participants which are shown in green.
- By default each observation is plotted in date order, meaning that observations made over a period of time may be spread out over many orbits of the binary star. To make the pattern of the curve easier to see, select Fold data by moving the slider at the top right of the light curve graph to the right. This combines data points from different orbits so that the graph represents a single orbit of the binary pair.