

2.1 Negative coordinates
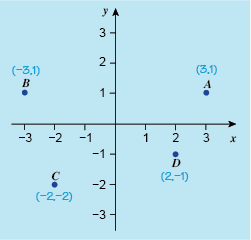
Figure 6 shows the axes extended downward and to the left, to include negative values. The coordinates of the plotted points still have the same configuration, that is, x first, followed by y, and are read in the same way as before. For example, point B is three units to the left of the origin, so its x-coordinate is –3. It is one unit up, so its y-coordinate is 1. So B has coordinates (–3, 1).
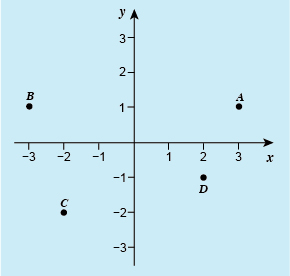
Now it is your turn to try your hand at reading the remaining coordinates from Figure 6 in this first activity of the week.
Activity 1 Reading coordinates
Write down the coordinates of points A, C, and D, shown in Figure 6. What are the coordinates of the origin?
Answer
A is opposite 3 on the x-axis, so its x-coordinate is 3. It is opposite 1 on the y-axis, so its y-coordinate is 1. The coordinates of A are (3, 1).
C is opposite -2 on the x-axis, so its x-coordinate is -2. It is also opposite -2 on the y-axis, so its y-coordinate is also -2. The coordinates of C are therefore (-2, -2).
The coordinates of D are (2, -1).
The origin has coordinates (0, 0).
As well as being able to read coordinates of points on a graph it is also important to be able to plot them yourself, for when you need to draw your own line graph. There is probably not much need for this in your day-to-day life, but many different study areas make use of graphs to show data and relationships. So a good working knowledge of how to construct a graph will stand you in good stead if you continue with your studies in the future.
You’ll look at plotting points in the next section.