4.1 Spatial scale
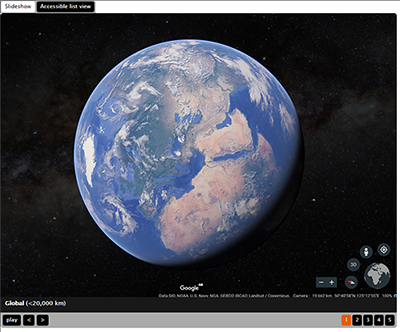
As hinted at in Section 2, considering biodiversity on a spatial scale requires a more specific boundary to be set. For example, when looking at a global level, the pattern of biodiversity demonstrates that more than half of all plant species live in the moist tropical rain forests – an area that covers just 6% of the world’s land surface – while Earth’s desert biome has low biodiversity. However, at a local level, an oasis in the middle of a desert (e.g. the Cuatro Ciéngas Basin in Mexico) could have a higher biodiversity than a plantation forest in the middle of a rainforest biome. This example demonstrates the need to understand spatial scale in terms of hierarchy, from local to landscape, then on to regional, continental and global scales. (See Figure 12 for a diagrammatic description of this arrangement.) It should be noted, however, that these scales are arbitrary and often follow an accepted organisational level.
An analogous example is the way human societies are organised in tiered arrangements of administrative levels.They range from municipalities up to countries, and then to regional organisations – for example, the European Union – and, at a global level, the United Nations.
When it comes to biodiversity, the reason for such organisation is often related to levels of environmental drivers, be they climate or geological. This is covered in more detail in Section 5.
Activity 6 Species distribution
Think of a species that is common in your locality. Try to find its distribution map on iSpot [Tip: hold Ctrl and click a link to open it in a new tab. (Hide tip)] or another resource such as Map of Life. Comment on its prevalence at the local, landscape, regional, continental and global scale.
Answer
You should have collected a series of maps and left a comment on each one regarding your chosen species’ prevalence.

