

4.6.2 Testing for the presence of infection
You'll now use the digital microscope to test for the presence of infection.
Activity 4.6.1 Activity 1 Using the digital microscope
Before you access the digital microscope read through the following instructions for the leukocyte counting activity carefully:
- Remember to increase the magnification to help you count leukocytes by clicking on the circle labelled ‘×20’ in the top left corner of the screen.
- Locate the square button labelled ‘Grid’ below the camera symbol on the left of the screen and click on it so that the grey counting grid appears to help you count systematically.
- Now choose which track you wish to count (A-U) and click on the appropriate letter. This will take your viewer (a red square) to the far left of the correct track so that you can begin counting.
- Count the number of leukocytes (if any) in the red grid square on the far left of your track noting down the number of leukocytes into the grid square number 1 of Table 1 (see below).
- Return to the digital microscope and click once on the red arrow pointing to the right in the small box below the blood smear. This moves the blood smear an exact distance to the right, so the red square is now around Grid square 2 in your track.
- Count the leukocytes (if any) in Grid square 2 and enter the number into Grid square number 2 in Table 1.
- There are 29 complete red grid squares in every track, plus ‘half’ a grid square (numbered 30) at the right-hand edge of the track, which you should include in your counts. You can then keep moving the slide one red grid square to the right by clicking once on the red arrow and counting and recording the number of leukocytes in each red square until you finally reach the right-hand margin of the slide.
- Finally, add up the total number of leukocytes in your track of the Normal blood smear and enter the total in Table 1. Once you have completed a table for your one of the slides (e.g. the normal slide), repeat the process for the other slide (e.g. the leukocytosis slide).
Table 1 Table for recording the number of leukocytes in your track of the Normal blood smear.
Note that some leukocytes will inevitably sit across the margin of a grid square, as in the example in Figure 7.
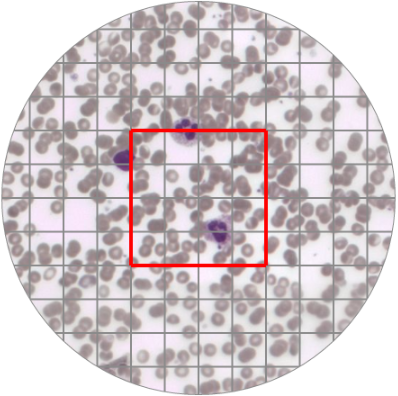
This is a very common occurrence in biological investigations where large numbers of ‘subjects’ (e.g. cells or organisms) are counted systematically using a grid to ensure that every cell or organism is accurately recorded.
If a leukocyte is ‘divided’ by a grid line on the left or the right margin of the red square, it is still in ‘your’ track so it will count towards your track total no matter which grid square you decide to record it in Table 1. But if a leukocyte is partly inside and partly outside the upper or lower margin of a red square (as in Figure 3), you must make a decision about whether to count it in ‘your’ track or exclude it as belonging to the track above or below yours.
Now access the digital microscope leukocyte counting activity on the Open Science Laboratory website [Tip: hold Ctrl and click a link to open it in a new tab. (Hide tip)] . (If you don't already have one, you'll need to sign up for a free Open University account in order to access this. The website will guide you through the process.)
Once you have counted the number of leukocytes for each slide, compare the two values. Do they differ? If so which one is larger? Does this support the suspected infection in the participant whose sample was taken for the ‘leukocytosis’ slide?
Discussion
You should have found that the leukocytosis slide contained more leukocytes than the normal slide. This supports the suspected infection in the participant whose sample was taken for the leukocytosis slide. Note that if you opted to count more than one track on each slide you would also have reached a more reliable answer to this question about suspected infection. This is because the larger the area you count the more representative this is of the number of leukocytes that are present in the blood as a whole.
You might also wish to reflect on how straightforward you found this counting process. Did you find it easy to decide whether to count a borderline cell or not? Was it easy to spot a leukocyte using the purple staining colour or was there an element of subjectivity involved?
We have designed this microscope activity to make it as close to the reality of cell counting on a microscope as possible. As such the subjectivity you may have applied to the counting process would be representative of the real experience of cell counting. Whatever subjective criteria you applied when deciding whether to count a leukocyte or not should have been applied consistently.