4 The ‘Going Out’ period
In the next video Dr Janet Liao introduces the rationale behind China’s shift in oil policy to a more outward looking approach.

Transcript: Video 4
China’s ‘Going Out’ strategy was formally initiated in October 2000. Part of the rationale for the ‘open door’ era was, as the name suggests, about bringing foreign investment into China. Much of this investment was in manufacturing industries, largely located in Special Economic Zones in the Southern, coastal regions of China. A high proportion of the output from these factories was then exported to the major consumer markets around the world. This model proved very successful for 20 years, as the GDP growth data we discussed earlier showed.
The Chinese realised that this model could not be sustained indefinitely as domestic wages began to creep up and there was over-supply of goods and services in some sectors. So, after the strategy of attracting FDI to China, Beijing wanted to encourage SOEs (including the NOCs) to go global, to find markets for Chinese goods and services and to secure raw materials. The strategy to encourage and support Chinese companies to invest overseas was achieved through incentives and subsidies as well as liberalisation of regulatory systems and administrative rules (China Policy, 2017).
During this process, the Chinese state played a predominant role in China’s energy and finance sector, via financial provisions to Chinese NOCs through its two policy banks – the China Export and Import Bank (CHEXIM) and the China Development Bank (CDB). Among the $114 billion of outward foreign direct investment (OFDI) loans provided by Chinese banks between 2000 and 2014 to support Chinese energy companies going global, 88 per cent was from the CDB and CHEXIM, and only 12 per cent was from commercial banks in China.
Between 2000 and 2014, China’s global energy investment was resource-seeking – Chinese energy companies had a clear preference for mergers and acquisitions (M&A) over greenfield investment, with the former accounting for 82 per cent of the total investment (Kong and Gallagher, 2017). Over the past decade such state orchestrated coordination between its energy and finance industry has not only enabled the Chinese energy companies to become global investors in the form of OFDI and cross-border M&A, but also made China the world’s leading provider of finance for energy to governments around the world.
Activity 2 Exploring OFDI data
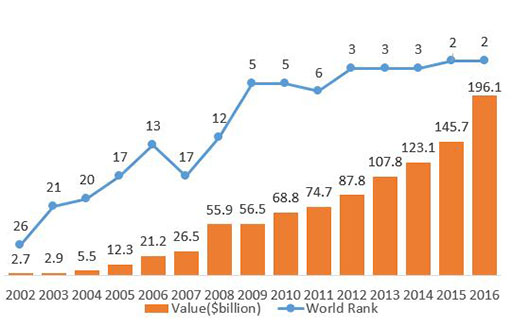
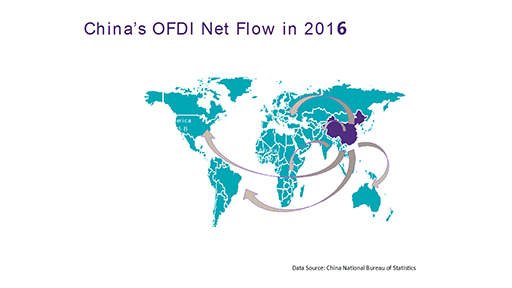
Below are two representations of data on Chinese outward FDI, or OFDI. One is a graph showing the annual volume of OFDI with a line showing where China ranks in global terms in this regard. The other is a map of where the investment went in 2016. Have a go at answering the following questions, which don’t require a detailed understanding of statistics.
- Roughly how many times bigger was the volume of OFDI in 2016 compared to 2002?
- In what year was the biggest relative jump in OFDI?
- In what year was the biggest absolute jump in OFDI?
- In what year did China jump the fastest up the global rankings?
- Which region received the most OFDI in 2016 and why?
- Which region received the least OFDI in 2016 and why?


Answer
- The volume of OFDI was roughly 73 times bigger in this 14 year period. This large jump demonstrates China’s move from being a net importer of FDI to a net exporter of FDI.
- Between 2007 and 2008 the value of OFDI doubled from $26.5 to $55.9 billion.
- The biggest absolute jump in OFDI occurred between 2015 and 2016 when it rose by just over $50 billion
- Between 2008 and 2009 China jumped seven places from 12th to 5th. This was during the depths of the global financial crisis and China was relatively insulated from it, so used its large foreign exchange reserves to make large investments overseas.
- Asia received the most, which suggests China is mainly a regional player seeking markets and supply chains closer to hand. It has made large investments in the advanced economies of Europe and North America where returns are increasingly profitable.
- Africa received the least OFDI. This may seem surprising given the subject of this module, but while absolute amounts are relatively low, they are investing in countries with small economies so that even one or two large investments can have a comparatively big impact.
As the Chinese economy internationalised Chinese firms, banks and government departments had to deal with the governments and businesses of global South countries, with their own histories and experiences of economic and political development. The interactions between China and a range of countries in the global South requires us to consider the politics of these relationships, which you will do in Session 2.
