

2.1 Reading tables
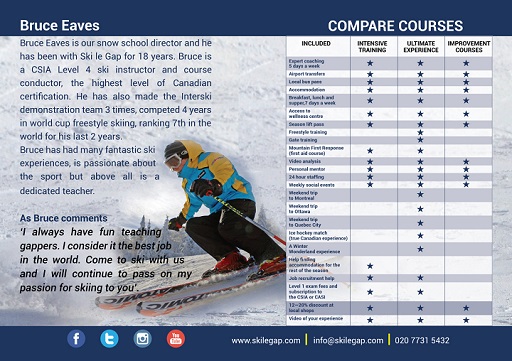
Look at the following example from a brochure. Being able to understand the table is important because that will help you to pick the skiing holiday that suits you best.
Example: The weather
If you look in a newspaper, it will probably have a section that tells you the weather forecast. It might even have this information in a table that looks like this:
| Location | Today | Tomorrow | ||||
|---|---|---|---|---|---|---|
| Weather | Min. temp. (°C/°F) |
Max. temp. (°C/°F) |
Weather | Min. temp. (°C/°F) |
Max. temp. (°C/°F) |
|
| South and southwest | 22/72 | 27/81 | 16/61 | 21/70 | ||
| Midlands | 22/72 | 28/82 | 24/75 | 31/88 | ||
| Scotland | 20/68 | 24/75 | 19/66 | 21/70 | ||
| Wales | 15/59 | 19/66 | 17/63 | 21/70 | ||
| Northern Ireland | 18/64 | 24/75 | 21/70 | 27/81 | ||
This could have been written out like this:
- The weather today in the south, southwest, Midlands and Scotland will be sunny. In Wales there will be showers and in Northern Ireland there will be storms. Tomorrow it will be sunny, with showers in the south and southwest. It will be sunny in the Midlands and Northern Ireland, and there will be storms in Scotland and Wales.
Can you see how displaying the information in table form made it easier to understand?
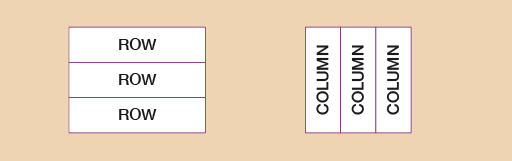
Tables are made up of rows and columns. Rows are horizontal (that is, they go across the page) and the columns are vertical (up and down).
To make sense of a table you need to have three things:
- A title that tells you what the table is about. In this table the title is ‘Weather update’.
- Row headings that tell you what is in each row. In the weather table the row headings are:
- South and southwest
- Midlands
- Scotland
- Wales
- Northern Ireland
- Column headings that tell you what is in each column. In the weather table the column headings are:
- Location
- Today
- Tomorrow
Tables can be very big, with many rows and columns – it depends how much information you are displaying.
For example, in a bus or train station you will see a huge timetable on the wall with many rows and columns. It is supposed to make the data easier to understand, but it is still complicated and easy to get confused.
Timetables often use the 24-hour clock. If you are not familiar with this, please see the section on time in Session 2 [Tip: hold Ctrl and click a link to open it in a new tab. (Hide tip)] before you try these activities.
Example: A bus timetable
Look at the following page from a bus timetable:
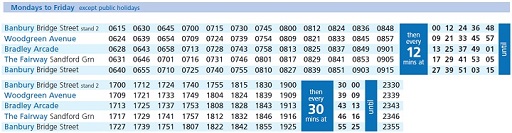
Mr Newman would like to catch a bus from Woodgreen Avenue to visit his son in Bridge Street, in Banbury. He would like to get there before 8:45 a.m. What’s the latest bus he can catch to arrive at his son’s house in time?
Method
The latest bus he could catch is the 8:21 a.m. bus from Woodgreen Avenue, which would arrive at his son’s house at 8:39 a.m.
To work this out, you start by looking at which bus arrives at Bridge Street before 8:45 a.m. Following the row across from Bridge Street in the left-hand column, you can see that a bus arrives at 8:39 a.m. (The next bus arrives at 8:51 a.m., which is too late.) You then need to look up this column to find out what time this bus leaves Woodgreen Avenue, which is 8:21 a.m.
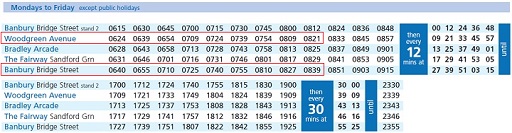
Activity 4: Reading a bus timetable
Use the same timetable to answer the following question:
Sian has to attend an interview at The Fairway at 9 a.m. What time should she leave Woodgreen Avenue?
Hint: Use the method described in the last activity.
Answer
A bus arrives at the Fairway at 8:53 a.m., so Sian would need to catch this bus from Woodgreen Avenue at 8:45 a.m. If she caught the 8:57 a.m. bus from Woodgreen Avenue, she would not get to the Fairway until after 9 a.m.
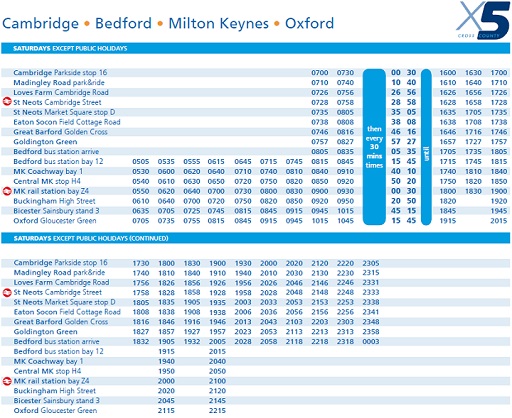
Activity 5: Reading another bus timetable
Look at another bus timetable in Figures 5a and 4b, and answer the questions that follow.
Hint: Make sure you look at the headings to see the days of the week to which each section of the timetable applies.
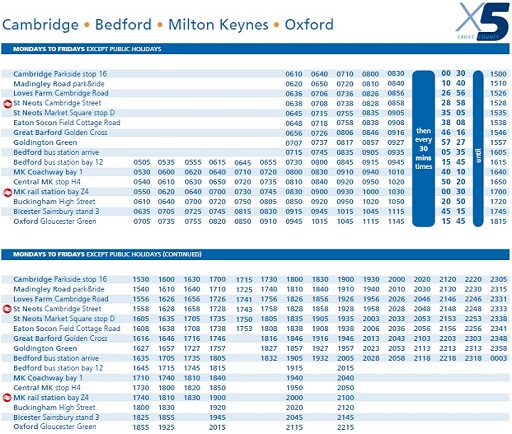
- What time does the first bus leave Parkside stop 16 in Cambridge on a Tuesday?
- What time does the last bus leave Madingley Road’s park and ride on a Saturday?
- David wants to meet a friend at Milton Keynes train station on Thursday at 9 a.m. What time should he leave Goldington Green? (Hint: Milton Keynes is shortened to ‘MK’ on the timetable, and train stations are shown using the rail logo in a red circle.)
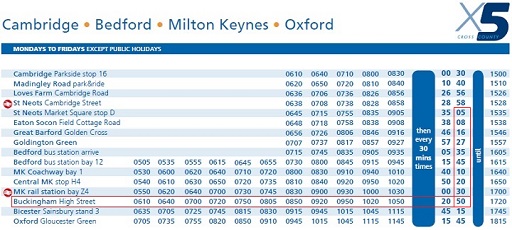
- On Monday, Susan arrives at Market Square stop D in St Neots at 10:45 a.m. What time is the next bus to Buckingham High Street, and how long will the journey take?
Answer
- The first bus leaves Parkside stop 16 in Cambridge on a Tuesday at 6:10 a.m. (which is written as ‘0610’ on the timetable).
- The last bus leave Madingley Road’s park and ride on a Saturday at 11:15 p.m. (which is written as ‘2315’ on the timetable).
- He should leave Goldington Green on the 7:37 a.m. bus, which arrives at Milton Keynes at 9 a.m.
After 9:05 a.m. on a Monday, buses arrive at the Market Square stop D in St Neots every 30 minutes at five minutes past and 35 minutes past each hour. So if Susan arrives at the stop at 10:45 a.m., the next bus will be at 11:05 a.m.
The bus arrives at Buckingham High Street at 12:50 p.m. To work this out, follow the minutes column down from the 05 (see timetable below) to the row for Buckingham High Street, where it shows 50 minutes past. However, this does not mean that the bus arrives 45 minutes later. If you look at the stops, you see the bus also stops at 8 minutes past, and then 16, 27, 35 and 45 minutes past; then it goes down to 10 minutes past, and then 20 and 30 minutes past before Susan’s stop at 50 minutes past. If you look at these times, you see that the bus travels for more than an hour, so the journey takes 1 hour and 45 minutes, or 105 minutes. (Another way to check this is to look at the journey times of an earlier bus where all times are shown in full: for example, the bus that arrives at Market Square stop D in St Neots at 9:05 a.m. arrives at Buckingham High Street at 10:50 a.m.)
Now try the following activities. Remember to check your answers once you have completed the questions.
Activity 6: A trip to the library
The local library has the following opening times:
| Day | Opening time | Closing time |
|---|---|---|
| Monday | 9:30 | 12:30 |
| Tuesday | 12:30 | 5:30 |
| Wednesday | 9:30 | 5:30 |
| Thursday | 9:30 | 12:30 |
| Friday | 9:30 | 5:30 |
| Saturday | 9:30 | 12:30 |
| Sunday | Closed |
- When is the library open all day?
- When is the library open only in the afternoon?
Answer
- The library is open all day on Wednesday and Friday.
- The library is open only in the afternoon on Tuesday.
Activity 7: The waiter’s shift
At the end of his shift a waiter drew up the following table to work out how many drinks he had served:
| Drinks | Number served |
|---|---|
| Tea | |
| Coffee | |
| Orange juice | |
| Hot chocolate | |
| Coke |
- The table does not have a title. What would be a suitable title?
- What are the row headings and column headings?
- How many Cokes did the waiter serve?
- How many cold drinks did the waiter serve?
- How many drinks did the waiter serve all together?
Answer
- A suitable title would be something like ‘Drinks served during shift’.
- The row headings are ‘Tea’, ‘Coffee’, ‘Orange juice’, ‘Hot chocolate’ and ‘Coke’. The column headings are ‘Drinks’ and ‘Number served’.
- The waiter served five Cokes.
- The waiter served two orange juices and five Cokes, making seven cold drinks in total.
- The waiter served 6 + 7 + 2 + 3 + 5 = 23 drinks in total.
Summary
In this section you have learned about handling data, and specifically, how to present data in tables.