

9 Finding the range
We talk about ‘range’ in real life in the following situations:
- Schools will have a range of ages of children.
- Companies will have employees on a range of salaries.
- Supermarkets have goods at a range of prices.
The first thing to do when finding ranges is to find the lowest and highest values in your data set. The range is one number that tells you the difference between the highest and lowest values.
To help you work out the range:
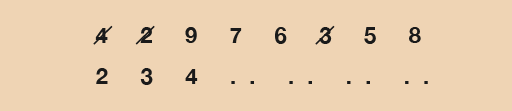
- If your data set is not too big then the best thing to do is put the values in numerical order (lowest first).
- As you go through the data set, tick or cross off the numbers as you put them in order so that you don’t count the same one twice or miss one out altogether:
Once you have the highest and lowest values, you then have to take the lowest away from the highest. This will give you the range.
The range measures the spread of a set of data. It is important because it can tell you how diverse your data is (or isn’t).
Take, for example, the ages of members of a gardening club. If the average age is 40 years old, say, then this doesn’t tell you much about the people in the club.
- If the spread of the ages was ten years, then you know that every member is in either their thirties or forties.
- But if the spread was 70 years, then both teenagers and pensioners belong to the club.
So the range gives you more information about a data set.
Remember that when you work out the range, you still have to include the units you are working in. So if you are dealing with ages you will usually be talking about years, so your range will be in years.
Example: Age range
Barry has four children. Sophie is 7 years old, Karen is 4, Max is 12 years and Jason is 10.
What is the range?
Method
The data set is:
- 7 4 12 10
Let’s put these numbers in order first:
- 4 7 10 12
Doing this makes it is easy to see that the lowest number is 4 and the highest is 12.
The range is worked out by taking the lowest value away from the highest:
- Range = 12 – 4 = 8 years
(Don’t forget to include the units, in this case years.)
Method summary
- Write the numbers in numerical order (lowest first).
- Find the lowest and highest numbers.
- Take the lowest number away from the highest number to find the range for your data.
- Don’t forget to put what units you are working in (e.g. hours, goals, people, etc.).
Now try the following activity. Remember to check your answers once you have completed the questions.
Activity 17: Finding ranges
Calculate the answers to the following problems without using a calculator. You may double-check your answers with a calculator if you need to. Remember to check your answers once you have completed the questions.
- Find the ranges for the following data sets:
- a.1, 6, 7, 10
- b.7, 6, 2, 8, 10, 3, 11
- c.5, 4, 2, 8, 9, 11, 4, 12, 7
- d.5, 15, 6, 9, 12, 4, 2, 8, 1, 14
- In a random survey in Tenby the ages of 20 people are as follows:
| 61 | 18 | 42 | 37 | 32 |
| 15 | 25 | 52 | 74 | 23 |
| 49 | 41 | 58 | 31 | 42 |
| 21 | 27 | 65 | 47 | 35 |
-
- a.Write the data set in order with the lowest number first.
- b.What is the lowest age?
- c.What is the highest age?
- d.What is the range?
- What is the range in temperatures in the following table?
| Day | Monday | Tuesday | Wednesday | Thursday | Friday | Saturday | Sunday |
|---|---|---|---|---|---|---|---|
| Weather | |||||||
| Temperature (°C) | 21 | 20 | 17 | 19 | 24 | 27 | 18 |
| Precipitation (%) | 15 | 25 | 40 | 70 | 20 | 5 | 86 |
Answer
Now check your answers:
- The ranges are as follows:
- a.10 – 1 = 9
- b.11 – 2 = 9
- c.12 – 2 = 10
- d.15 – 1 = 14
- The answers are as follows:
- a.Here’s the data set in order, with the lowest number first:
| 15 | 18 | 21 | 23 | 25 |
| 27 | 31 | 32 | 35 | 37 |
| 41 | 42 | 42 | 47 | 49 |
| 52 | 58 | 61 | 65 | 74 |
- b.The lowest age is 15 years.
- c.The highest age is 74 years.
- d.The range is 74 – 15 = 59 years. If you wrote ‘15 to 74’, it’s the wrong answer. The range is one number. You need to work out the difference.
- The highest temperature is 27°C and the lowest temperature is 17°C, so the range in temperature is 10°C.
Summary
In this section you have:
- learned that the range measures the spread of a set of data
- understood that the range is the difference between the smallest and largest values in a set of data.