

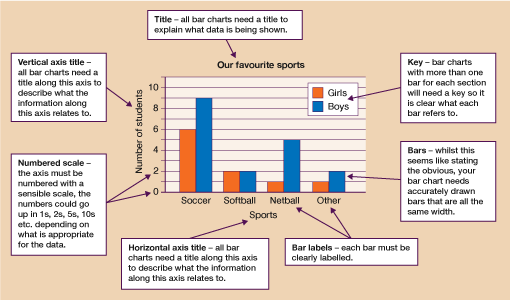
3.1 Features of a bar chart
Regardless of which type of bar chart you are drawing, there are certain features that all charts should have. Look at the diagram below to learn what they are.
Activity 3: Drawing a bar chart
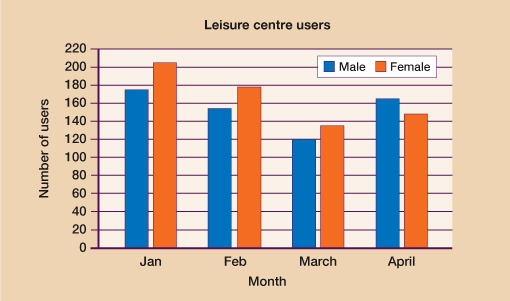
Draw a bar chart to represent the information shown in the table below.
| Leisure centre users | ||||
|---|---|---|---|---|
| January | February | March | April | |
| Male | 175 | 154 | 120 | 165 |
| Female | 205 | 178 | 135 | 148 |
Answer
Your bar chart should look something like the example below. You may have chosen to use a different scale but your chart should have the following features:
- a title
- labels on both the horizontal and vertical axes
- bars labelled with the month
- accurately drawn bars of the same width
- a numbered scale on the vertical axis
- a key to show which bars are for males and which are for females.
Now that you understand the features of bar charts and are able to draw them, let’s look at how to interpret the information they show.